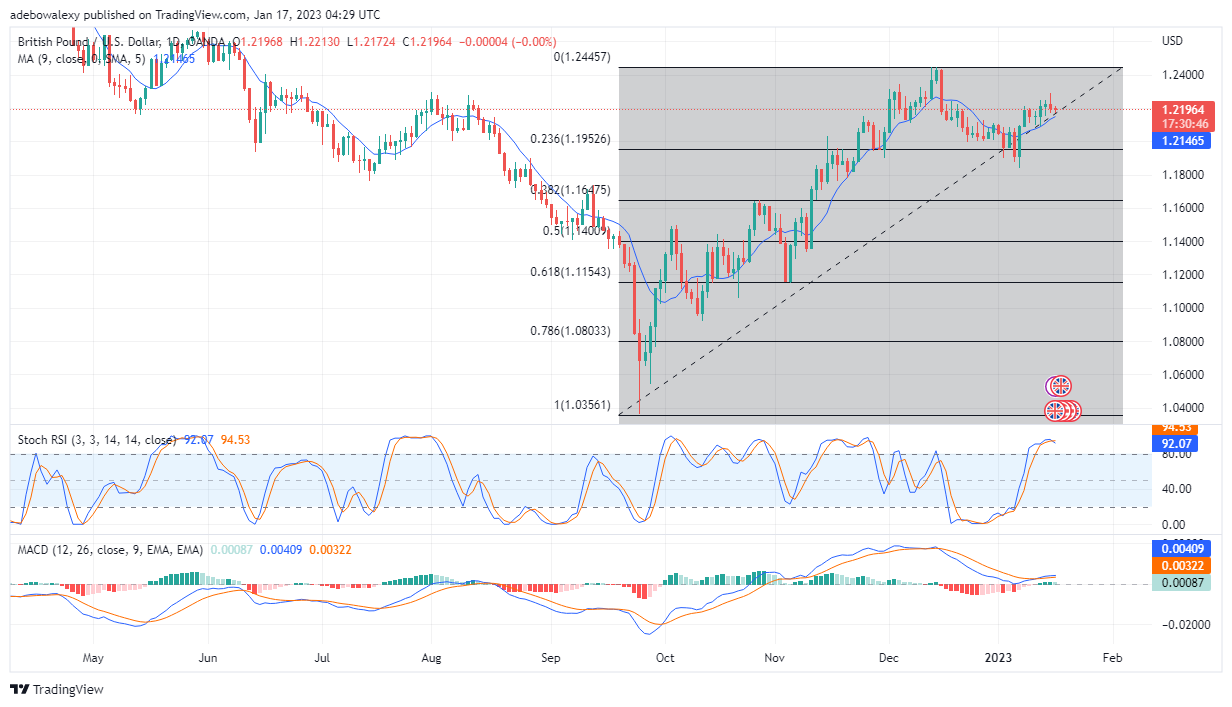
GBP/USD has experienced moderate gains in recent times, as its price rebounded off the Fibonacci support level of 23.60. Nevertheless, since the last trading session, downward forces seem to have had some minimal effect on price action. Will the market resume its upward path or fall to lower support? Let’s check it out!
Major Price Levels:
Top Levels: 1.2218, 1.2258, 1.2300
Floor Levels: 1.2196, 01.2156, 1.2116

Is GBP/USD Upside Price Move Succumbing to Headwinds?
Although with low magnitudes, market bears have managed to stay in control of the GBP/USD market. The last red price candle on this chart has a short body and keeps changing from red to green on the live market. Consequently, this reveals that bulls are still in the fight. Also, price action remains above the 9-day Moving Average curve. Meanwhile, the RSI lines are also in the overbought zone but have given a bearish crossover. Furthermore, the length of the MACD histogram bars shows that the upside momentum of late is weak. The lines of this indicator are now moving sideways. Consequently, market participants may witness GBP/USD price action taking a temporary dip.

GBP/USD Bulls Are Quickly Reacting
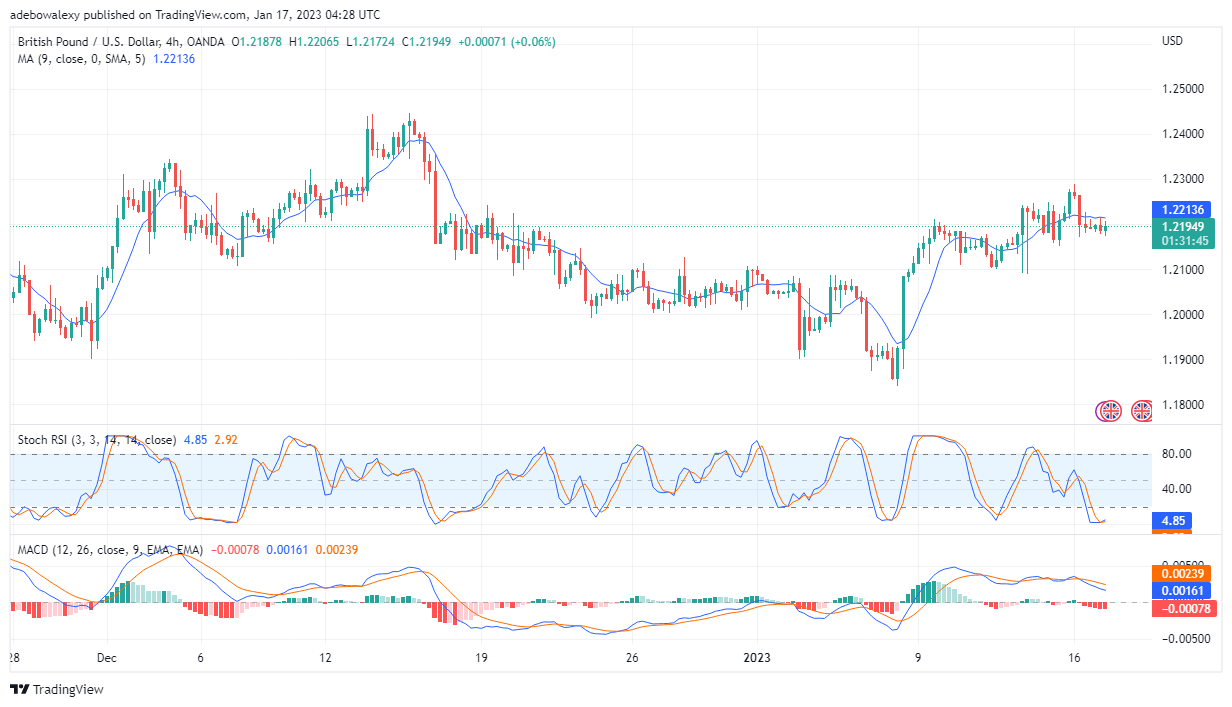
On the four-hour market, upside forces are quickly fighting back. It could be seen that a green price candlestick has formed for this session. Also, the RSI has given a crossover in the oversold area, which indicates that upside forces may be on the rise. Also, the MACD curves are still above the equilibrium point, but can now be seen moving almost sideways. Additionally, the histogram bars of this indicator are still solid red. Consequently, two things may result here, if bulls can mount a strong defense at the point, the perceived upward reversal may continue; however, should the reversal attempt be short-lived, the GBP/USD price may fall toward the 1.2140 price mark.
Do you want to take your trading to the next level? Join the best platform for that here.


Leave a Reply