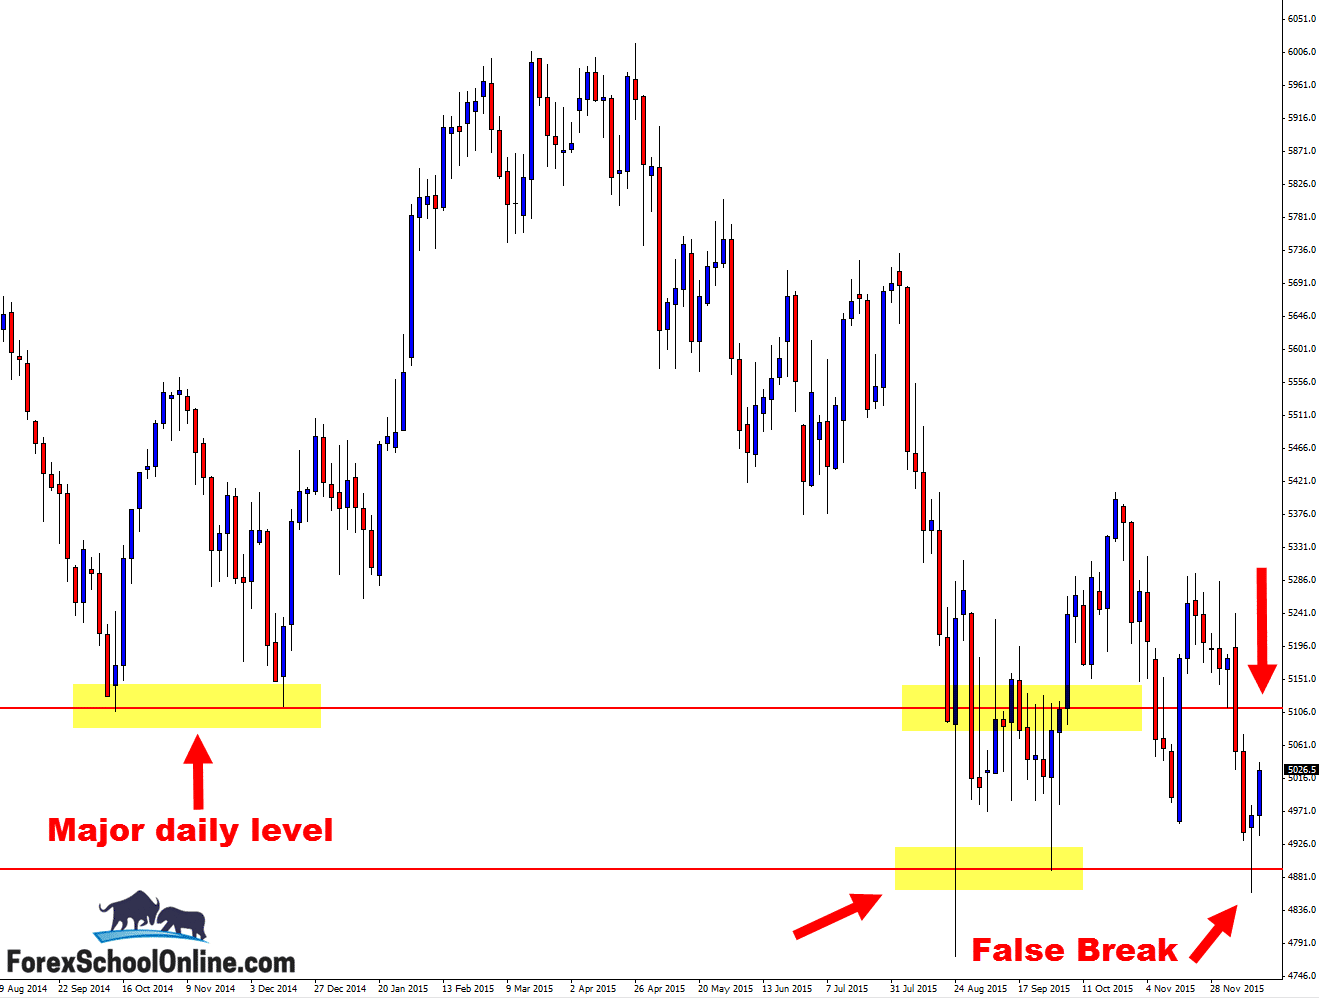
The ASX200 or the S&P200 which is the Australian stock index has fired off a false break pin bar reversal trigger signal which has sent price on a move higher.
Carrying on from the new method Friday where I showed you the Friday Forex Market Moves | 11th Dec 2015 I am going to put more emphasis on the charts which is going to hopefully educate you faster and in a way you can put what you are learning more practically into your charts.
Daily to 3 Day Chart
When I post a different time frame chart such as a 2 hour, 6 hour, 12 hour, 2 day or 3 day chart like I am discussing today, I get asked two questions normally which are;
I discuss my routine which is the cornerstone for my trading success here; Daily Routine of Forex Trader Johnathon Fox. In that lesson I discuss exactly how it is I go through my charts and work through the different time frames from the daily down to the intraday.
As I am flicking through my charts I am looking for trigger signals. If I see something such as a 2 bar or some sort of potential candle setup, then I will blend these candles by putting them together on the next time frame and seeing what they look like. Sometimes the next time frame is not available and this is where the MT4 Time Frame Change Indicator comes in super handy.
As I just went through above answering the last question; I change my MT4 time frames using an indicator called MT4 Time Frame Change Indicator. This indicator is super handy and allows any time frame to be changed from the 1 min onwards.
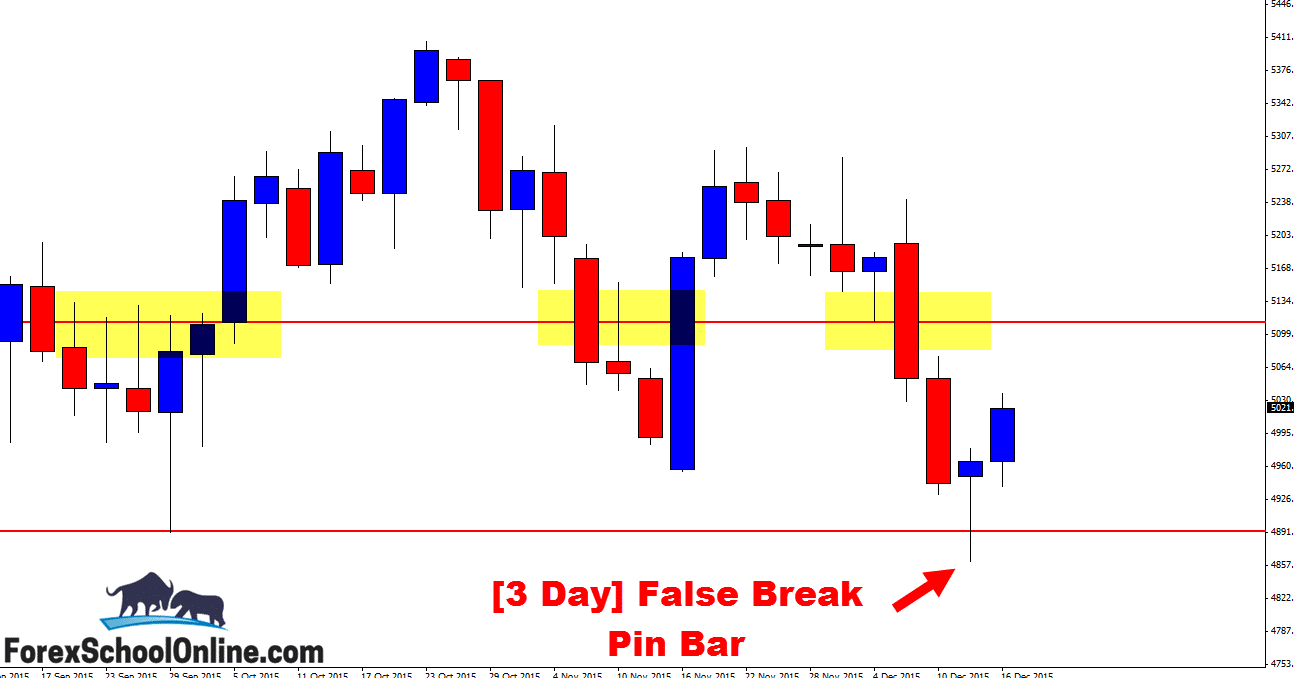
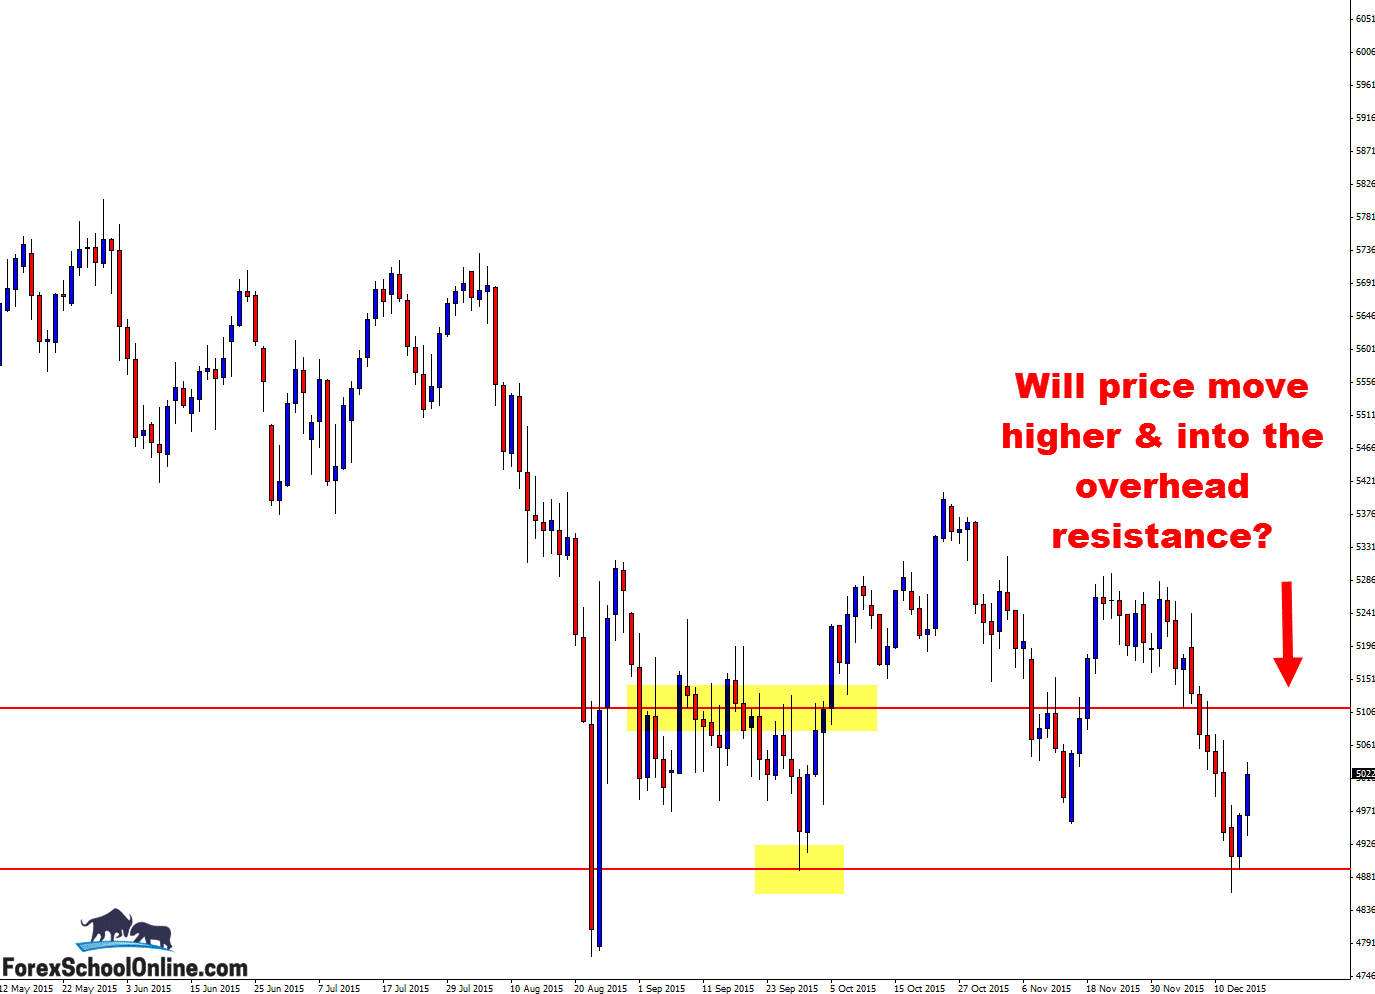
I used the MT4 Time Frame Change Indicator to make a 3 day chart of the ASX200 to see that a false break pin bar had formed. If price can continue it’s move higher, then the next major level looks to be around the 5112.00 area.
3 Day Chart – False Break Pin Bar
3 Day Chart – Major Daily Level

Daily Chart – Overhead Resistance


Leave a Reply