GBP/USD Annual Forecast – 2022
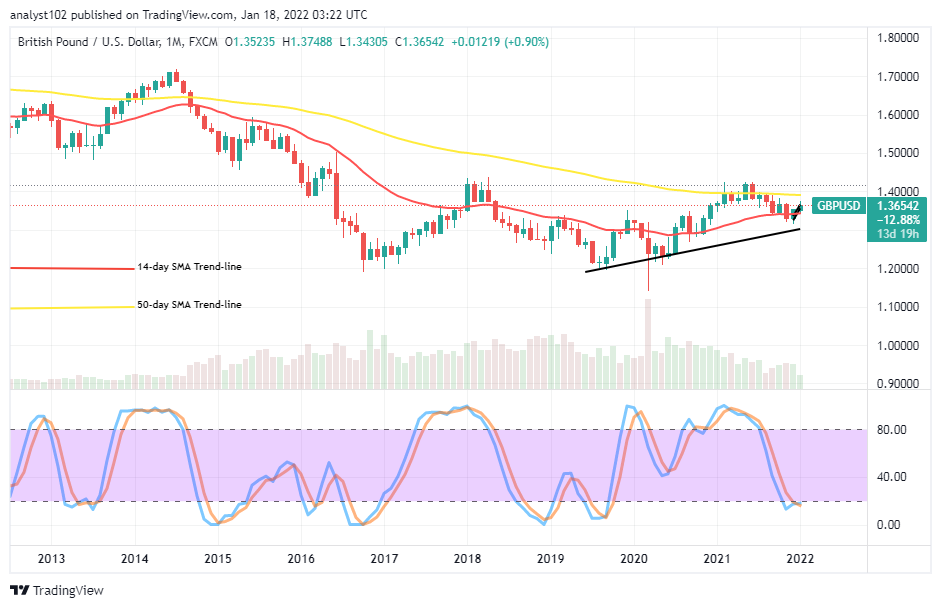
The GBP/USD market annual forecast for the 2022 trading operations has been underneath the resistance line at 1.4000 from around 2017 until the present. This year’s activities opened with about 1.3523 to have attained a higher point of about 1.3748 and a lower value-line of about 1.3430, keeping a minute percentage rate of 0.90 positives.
GBP/USD Market
Key Levels:
Resistance levels: 1.4000, 1.5000, 1.6000
Support levels: 1.3000, 1.2000, 1.1000
GBP/USD – Monthly Chart
The GBP/USD market annual forecast monthly chart reveals the currency pair price has been on the path of recovery since around March 2020. The market managed to spring forcefully northward against 1.2000 level after it was breached during the monthly sessions to put back the upward momentums on the track to the upside. The 50-day SMA indicator is closer beneath the 1.4000 level above the 14-day SMA indicator. The bullish trend line drew below the SMAs to ascertain the recovery path that price maintains to the north side as it touches the 1.3000 support level. The Stochastic Oscillators are down at the range of 20, trying to cross-open their lines to the upside. That signifies the potentiality that the currency pair market will likely keep more pressures to the up in the following months. From the GBP/USD market annual forecast analytical perspectives, will the 1.3000 level break down sustainably afterward?
From the GBP/USD market annual forecast analytical trading perspective, it appears that the 1.3000 will likely be serving as the support level for most of the subsequent downward forces that the market tends to make afterward. Therefore, by that assumption, traders intending to join a sudden southward pressure around that value line to the downside may be whipsawed in no time, especially if the motion experiences a timely-rebounding manner. Long-position takers needed to intensify more efforts in ensuring that the resistance at 1.4000 forcefully breached for sustainability to get a full-fledged bullish trend returning afterward.
On the downside of the technical analysis, many downward pressures appeared exhausted by the GBP/USD short-position takers over some months, as indicated by the readings of the Stochastic Oscillators. Nevertheless, a consolidation of the trading tool around the range of 20 may, in the long run, lead the price to get depressed to revisit its previous lower support level of 1.2000. As of writing, a bullish candlestick is in the making to signal invalidation of getting a falling force in the near time. As a result, sell orders may have to suspend for a while.
Summarily, it currently appears that the GBP/USD market operation will maintain its upward swinging recovery moves until a while. However, long-position takers would have to be alert on getting decent entries. A fearful reversal against late buying entries may amount to losing several positions on the short-term trading psyches. GBP/USD Weekly Chart
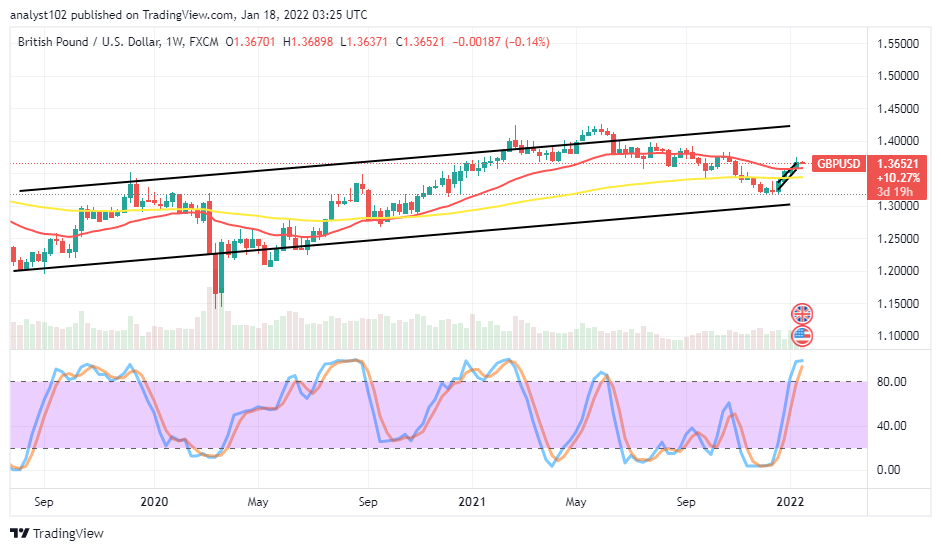
The GBP/USD market annual forecast weekly chart showcases that the currency pair price has been on a relatively bullish running outlook. The 14-day SMA trend line is above the 50-day SMA trend line. And, the bullish channel trend lines drew to monitor the paths within which the market keeps to the upside. Some weekly bullish candlesticks have emerged against the SMAs in the channels. The Stochastic Oscillators are in the overbought region, attempting to close their lines within it. That signifies the need for long-position takers to exercise some patience before launching more orders at this point. A sudden aggressive price movement against 1.3500 will potentially lead the market down to around 1.3000 level. 1.2500 level could be the maximal lower point and, the maximal higher could be close beneath 1.5000 for the market before the end of this year.
Note:Forexschoolonline.com is not a financial advisor. Do your research before investing your funds in any financial asset or presented product or event. We are not responsible for your investing results.


Leave a Reply