The US dollar has become more weakened today following mixed macroeconomic data that emerged yesterday. This has caused the USDCAD to dip further in today’s trading activities. Meanwhile, trading indicators still hold a considerable amount of optimism, conserving further price increases as soon as the market obtains support.
Key Price Levels:
Resistance Levels: 1.4100, 1.4200, 1.4300
Support Levels: 1.4000, 1.3900, 1.3800
USDCAD May Touchdown on the 1.4000 Threshold
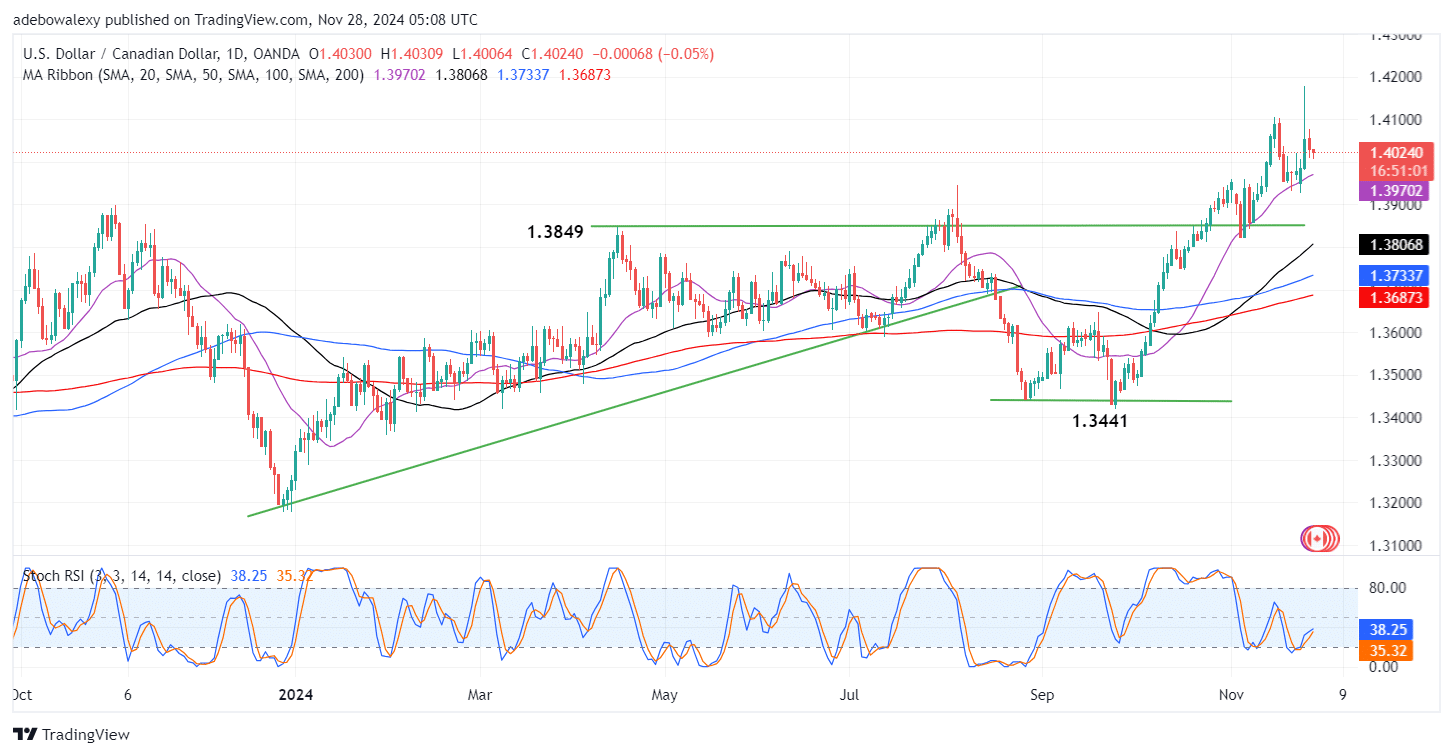
The USDCAD market has continued its downward retracement in today’s trading session. Nevertheless, price candles can be seen appearing above all the Moving Average (MA) lines, suggesting that downward forces are at a disadvantage. The last price candle on the chart has appeared to contract upward, leaving it with a conspicuous lower shadow.
This hints that upside forces are setting in gradually. Also, the Stochastic Relative Strength Index (RSI) lines are a bit deflected toward a bearish crossover, but the indicator line still has a general upward trajectory. Technically, this shows that upside forces are likely to impact the market positively at this point.

USDCAD Market Sees a Rebound at the 50-Day MA
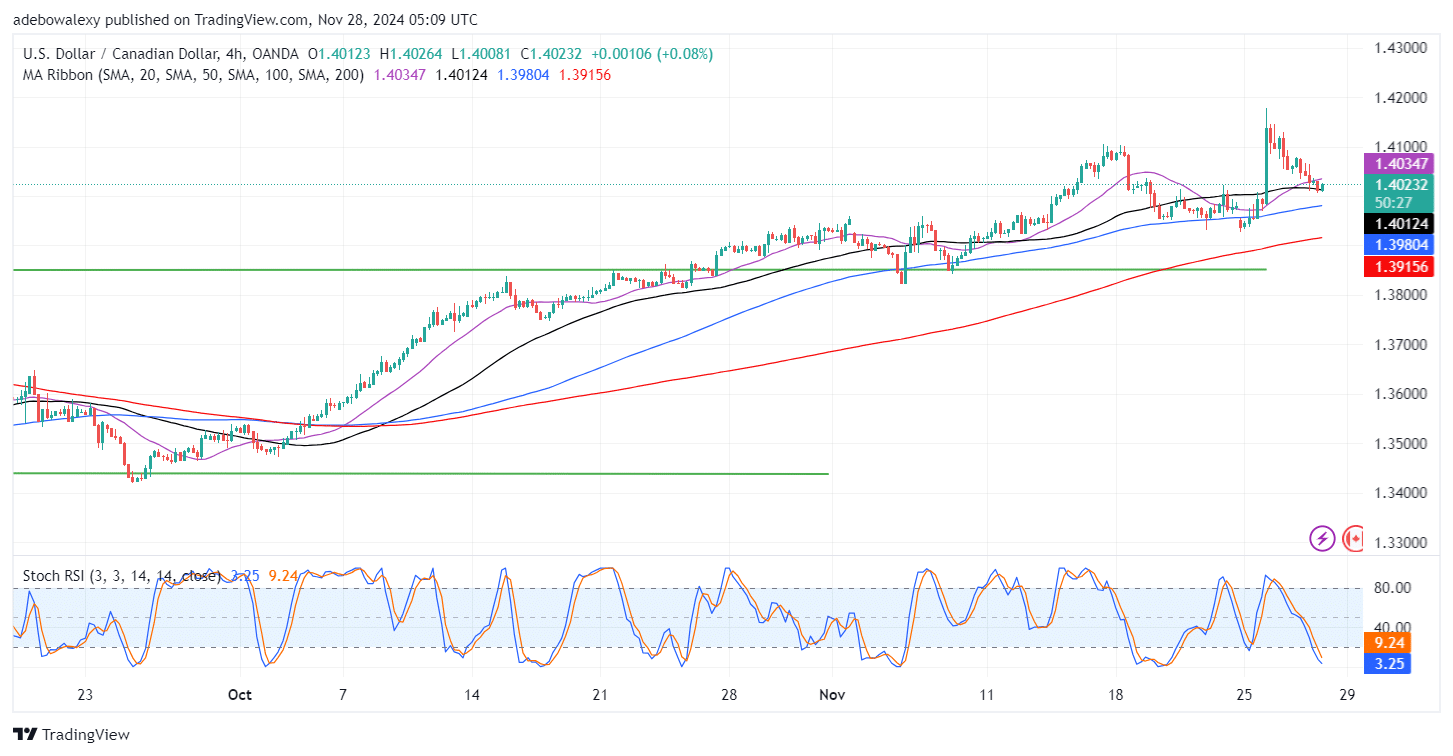
An upward rebound has occurred in the USDCAD market on a 4-hour chart. This happened following a short-term downward retracement. As of today, the market has seen an upside rebound off the 50-day MA line. This keeps the pair above most of the MA lines. Meanwhile, the Stochastic RSI lines can be seen falling still into the oversold region.
The leading line of the indicator can be seen almost touching the 0.00 mark of the indicator. Considering the fact that the seen downward retracement stands above most MA lines, it shows that downward forces are weak, going by the exaggerated movement of the RSI lines. Therefore, it appears that the 1.4000 may offer a strong baseline for the market to rebound towards the 1.4100 mark.
Do you want to take your trading to the next level? Join the best platform for that here.


Leave a Reply