The US dollar has been able to maintain its strong stance ever since the change in US leadership. This has kept the GBPUSD pair under bearish pressure. Meanwhile, the Pound side of the market seems a bit tranquil, even as speculations surrounding expansionary policies are expected to rekindle inflation, causing the Fed to cut interest rates slowly. This seems sufficient enough to keep the pair heading further south.
Key Price Levels:
Resistance Levels: 1.2600, 1.2700, 1.2800
Support Levels: 1.2500, 1.2400, 1.2300

GBPUSD Seems Under Renewed Bearish Pressure
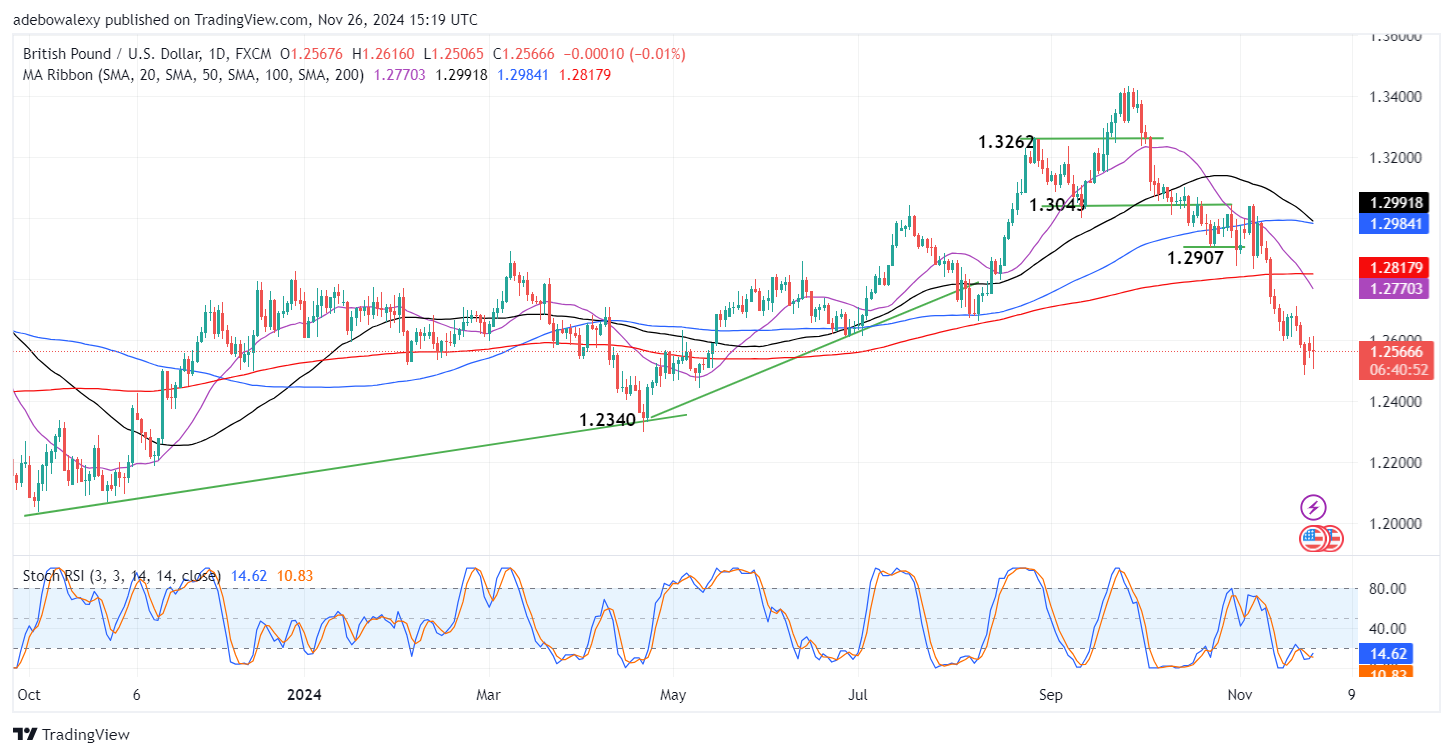
The GBPUSD daily market fell below the 1.2600 level three sessions ago. The market has made attempts to rebound upwards, but it seems that the 1.2600 price level has formed a strong resistance level. Subsequently, the market has made a smooth rebound off that price level, even until the ongoing session. The last price candle portrays that market forces are in a face-off – given the position and appearance of its body.
Price action has fallen below all the Moving Average (MA) lines, with the 20- and 200-day MA lines delivering a downward crossover above price activity. Likewise, the 50- and 100-day MA lines can be seen approaching another crossover above price movements. The Stochastic Relative Strength Index (RSI) lines have performed a bullish crossover below the 20 mark. The mentioned level is still in the oversold region, and the crossover may not impact price movement.

GBPUSD Market Is Yielding to Headwinds
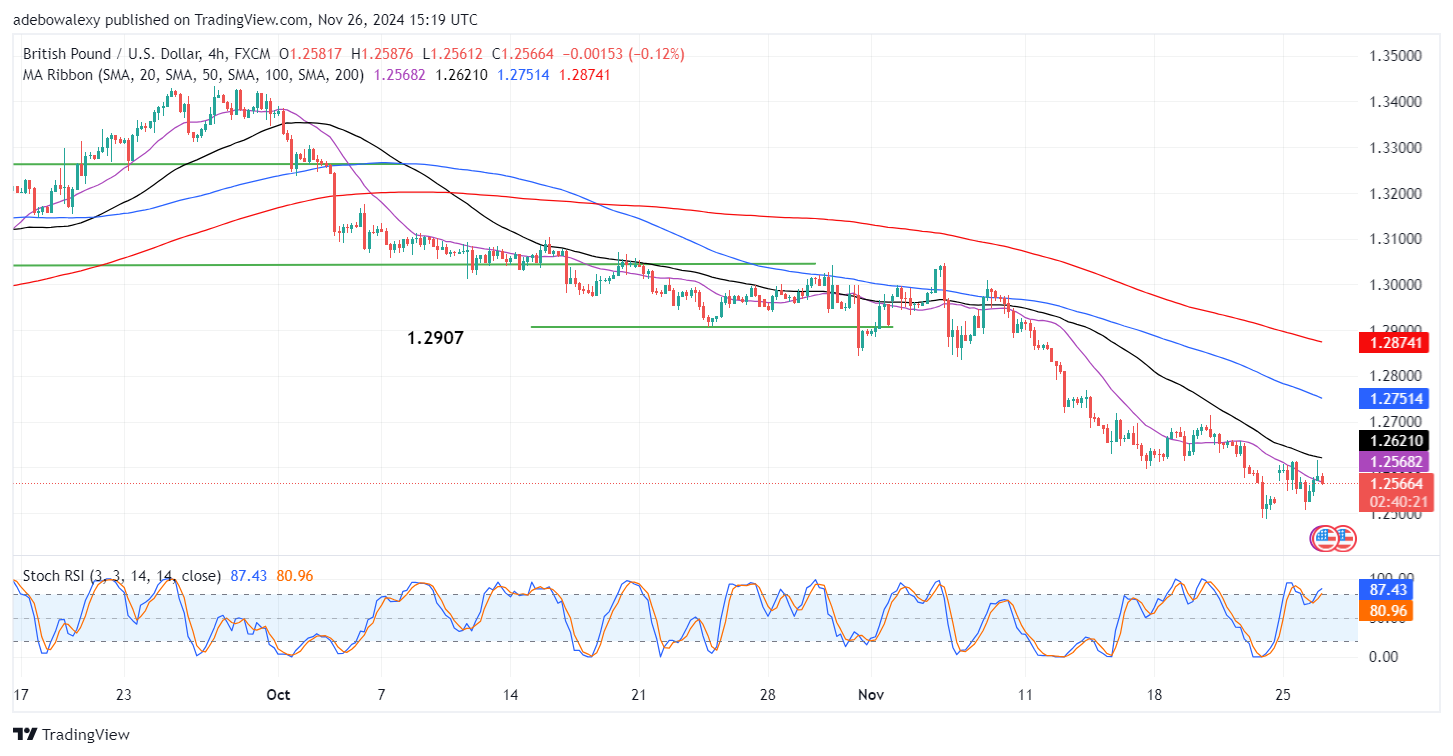
The GBPUSD 4-hour price chart has revealed that price action has rebounded upwards over the past three sessions. However, the previous session experienced a strong downward contraction, which brought the market back below the 1.2600 threshold level. Eventually, the subsequent (ongoing) session can be seen to have yielded further and has returned the market below all the MA lines on the chart.
The Stochastic RSI lines can be seen to have punched their way through the 80 mark of the indicator. However, a more careful look at the leading line of the indicator shows that the line of the indicator is slightly curved, hinting that a bearish crossover may result soon. Combining this with the fact that price action is now below all the MA lines, it appears that the market may journey toward 1.2500 as support.
Do you want to take your trading to the next level? Join the best platform for that here.


Leave a Reply