Tamadoge Price Prediction – November 13
From the angle of medium-term chart technical perspective at this point, it appears that bears are systemically making an impact on a slight mode, given that the TAMA/USD market currently draws a base, re-building bounce signals.
The negative sign that is now present at the time of this article indicates that a trading cycle is preparing to secure good, perfect longing position orders, as has been acknowledged. The trade signal scenario must thus be seen as a caution to sellers to avoid becoming entangled in a long-term whipsaw setting process.
Resistance levels: $0.0015, $0.0025, $0.0035
Support levels: $0.00075, $0.0005, $0.00025
TAMA/USD Medium-term Chart
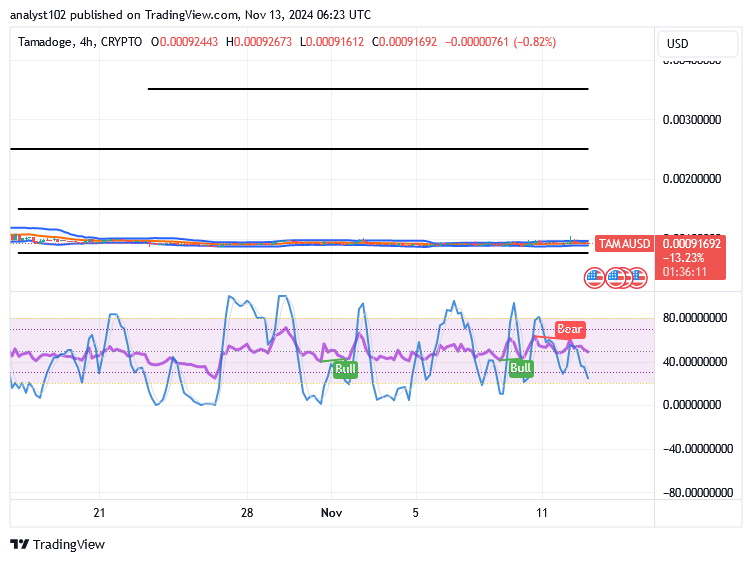
The medium-term TAMA/USD chart mirrors that the crypto-economic price draws a base, re-building bounces inputs.
Lower lows have been shown to dominate the outlook a little more than lower highs in the emerging arrangement of variant candlesticks. The length being implemented on the negative side, nevertheless, doesn’t appear to be trustworthy. The Bollinger Bands trend lines, which extend eastward from the $0.001 points, are still unchanged. The stochastic oscillators have shifted southward, momentarily crossing the 20-point mark and into the oversold area.
Given that the TAMA/USD market has been trading sideways for a while, will the price drop further from $0.001?
It is logically inkling for long-term position pushers not to be allowed to get bored by the elongation of trade sideways in the market valuation of Tamacoin versus the trade worth of the American currency, given that the price now draws a base, re-building bounces signs.
Even in the absence of concrete power moves to reestablish the wall to the north, the prevalent technical theory still holds that the accumulation of points must continue in accordance with the dip purchase concept. It is reasonable to assume that customers will eventually rescind their decisions.
The TAMA/USD short-term
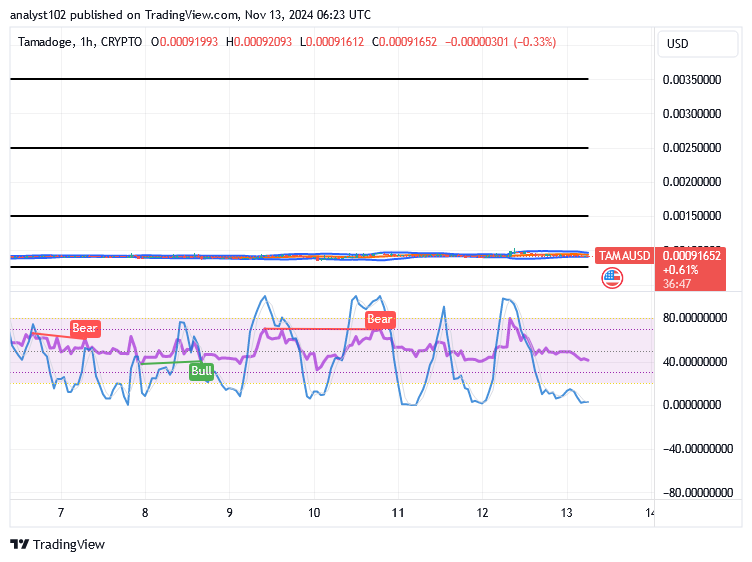
The TAMA/USD short-term chart showcases that the crypto-economic trade draws a base, re-building bounces signs.
As has been demonstrated in the last several hours from the hourly angle of the chart, it shows that bears are having a lighter control than bulls in the market. In the details of that, the trend lines of the Bollinger Bands are stretching to the east. The stochastic oscillators have penetrated the oversold region, showing that buyers are at a lower end trying to gain stances.
Get your share of TAMA prizes by beginning to play any game in the Tamaverse right now.
Take part in the action right now!
🚨 Attention all #Tamadoge gamers! It’s your last shot to climb this week’s leaderboard! 🚨
— TAMADOGE (@Tamadogecoin) August 7, 2024
Start playing any game now in the Tamaverse and earn your share of $TAMA rewards.
Get in on the action now! 👇 pic.twitter.com/5rctPoReet
Do you want a coin that would 100X in the next few months? That is Tamadoge. Buy TAMA today
Note: Forexschoolonline.com is a financial advisor. Do your research before investing your funds in any financial asset or presented product or event. We are not responsible for your investing results.


Leave a Reply