Lucky Block Price Prediction- November 2
The LBLOCKUSD price could see an uptrend soon after the pair completes the dip-low movement. The coin price is on the verge of reversal to a new corrective pattern. The crypto price might rebound from the $0.00002003 daily support and turn upside as the market is oversold. Hence, if all the current support holds and the bulls should push higher, the price breakout may test the previous high at a $0.0000398 high value and surge to meet the $0.0001200 upper resistance level, indicating a significant upward trend.
Key Levels:
Resistance levels: $0.0000218, $0.0000219, $0.0000220
Support levels: $0.0000189, $0.0000188, $0.0000187
LBLOCKUSD Long-term Trend: Bearish (Daily Chart)
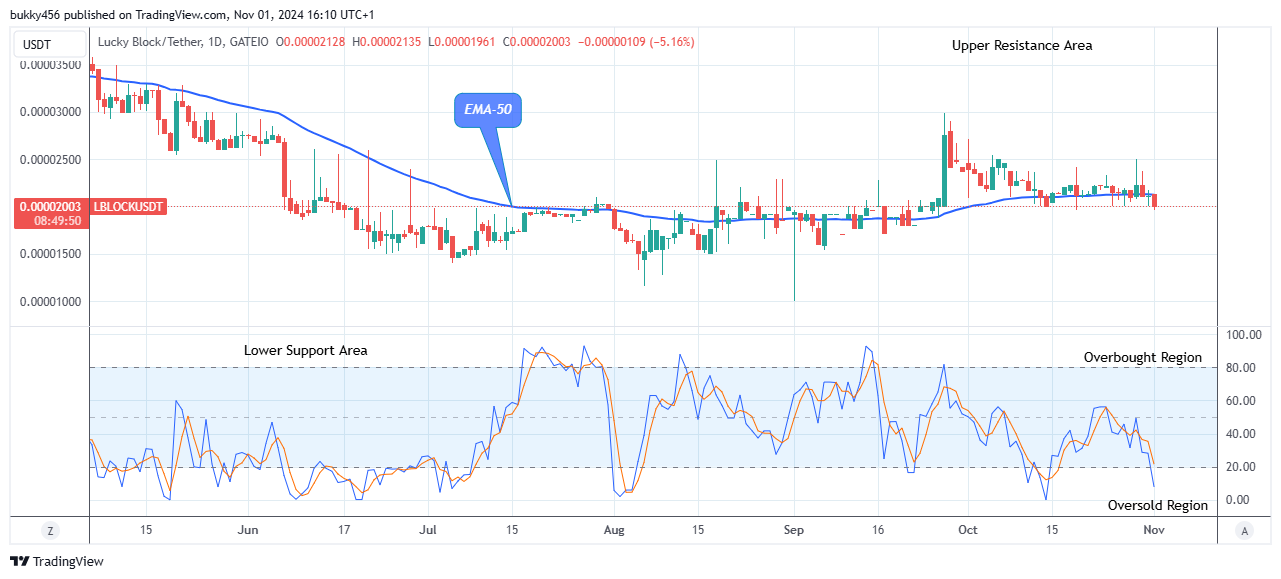
LBLOCKUSD bearish pressure is about to subside, and the price could see an uptrend soon as the market reaches the oversold region in its long-term view. The price is below the EMA-50, indicating a downward momentum and the high impact of sellers in the market.
The sustained bearish pressure to a $0.0000210 low mark in the past few days has contributed to its bearishness in its recent low. Meanwhile, the LBLOCKUSD buyers could see an uptrend soon as the selling pressure seems exhausted.
Meanwhile, the current price of Lucky Block at a $0.0000196 low value below the supply trend lines as the daily chart opens today has not stale the market condition of the crypto. Thus, traders who buy the coin during the bearish market will also make gains in the future.
However, the crypto price could see an uptrend to reach the $0.0000398 previous barrier if the bulls could increase their swagger and wrestle trend control with the bears at the $0.0000196 support level.
Further, the Lucky Block market has fallen to the oversold region of the daily stochastic, implying that the selling pressure is likely to end soon. As a result, the crypto price could see an uptrend extending to the $0.0001200 upper high mark in the coming days as the token aims to see an uptrend soon in its long-term perspective.
LBLOCKUSD Medium-term Trend: Bearish (4H Chart)
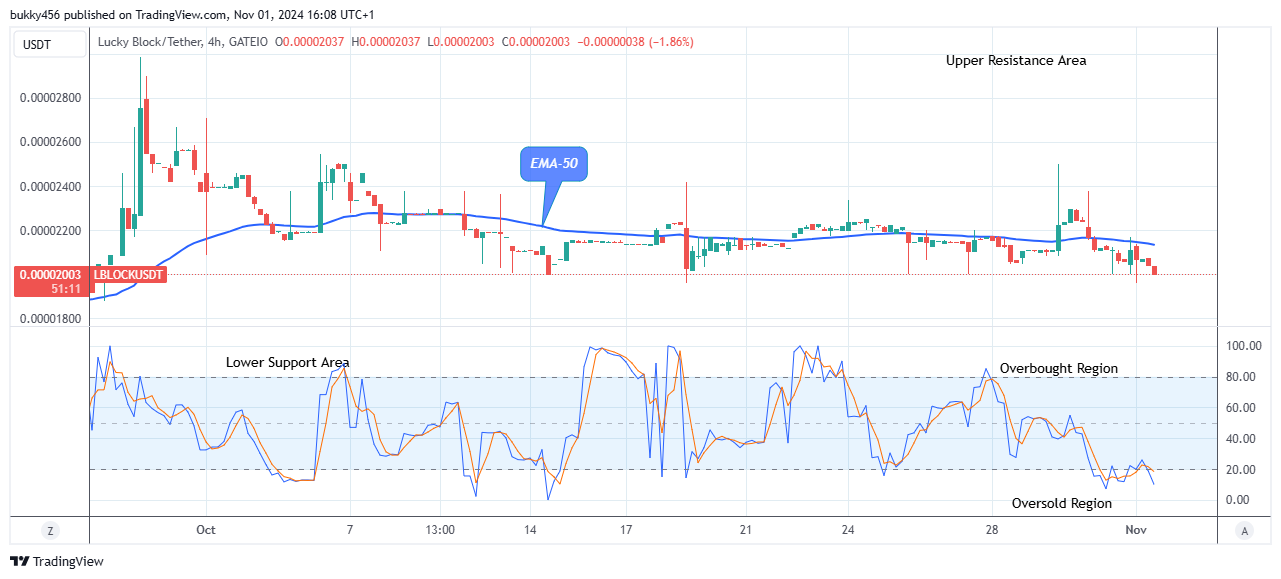
After completing the downward movement, the LBLOCKUSD price could see an uptrend soon, as the selling pressure is about to subside on the medium-term outlook. LBLOCKUSD is showing a downward movement. This is clear as prices continue to make lower highs and lower lows.
Today, the Lucky Block sellers drove the coin price to a low of $0.0000200 below the moving averages as the 4-hourly chart resumes.
All eyes are glued on $0.0000298, but seller congestions at $0.0000200 have become impenetrable. Hence, if bulls could change their orientation and add more strength to their buying forces, the Lucky Block price could see an uptrend to the $0.0000298 resistance level, resulting in a turnaround for coin buyers.
Additionally, the LBLOCKUSD pair has fallen below the 10% range of the daily stochastic, suggesting the pair could see an uptrend soon. We will now focus on the emergence of buyers in the oversold region of the market. As a result, the price could see a trend or surge upsides to hit the $0.0001200 resistance value in the days ahead in its medium-term outlook.
You can purchase Lucky Block here. Buy LBLOCK


Leave a Reply