Lucky Block Price Prediction- October 5
Today, the Lucky Block market flashes a bullish trend reversal as it is about completing the dip-low movement and is on the verge of a correction phase. The coin price might rebound and turn upside as the market is oversold. Hence, if all the current support holds and the bulls should push higher, the price breakout may test the previous high at a $0.0000450 value, and this could send the coin price soaring to $0.0001200 supply trend line, denoting a bullish trend and a rise in volatility.
Key Levels:
Resistance levels: $0.0000250, $0.0000260, $0.0000270
Support levels: $0.0000180, $0.0000170, $0.0000160
LBLOCKUSD Long-term Trend: Bullish (Daily Chart)
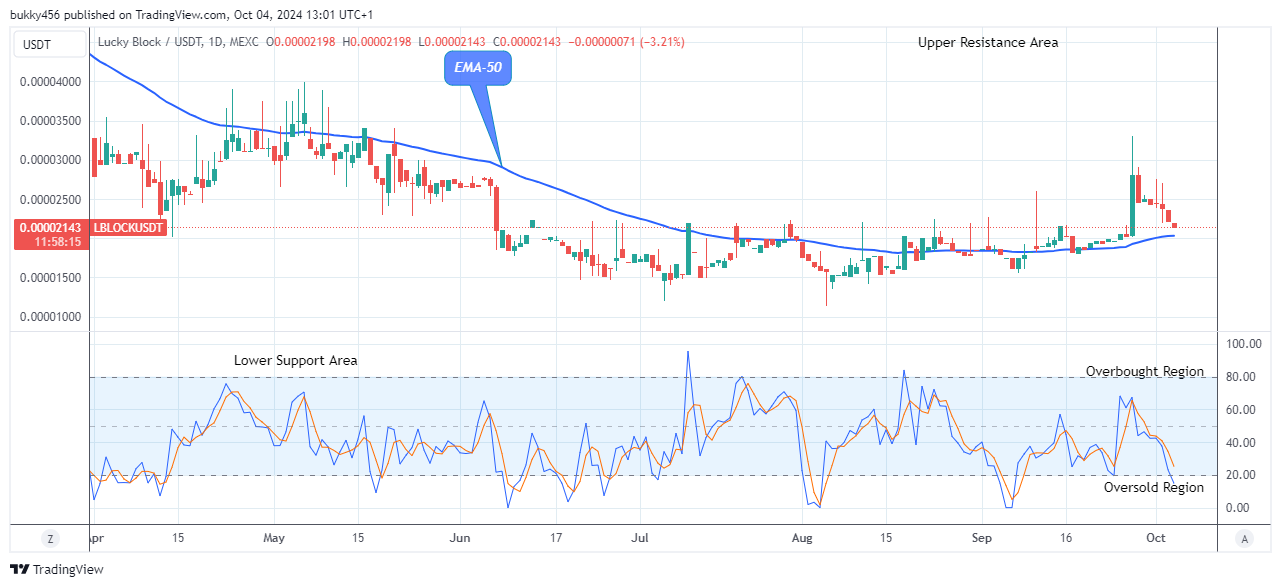
The LBLOCKUSD flashes a bullish trend reversal as the market seems to be oversold, waiting for a bullish breakout in its long-term view. The price trades in red above the 50-day exponential moving average, a bullish indicator.
The bulls’ sustained pressure to the $0.0000330 resistance value on the 27th of September has enhanced the coin price to stay above the supply level in its recent price level.
Despite the move by the sell traders, the LBLOCKUSD price remains in an upward trend. However, at the writing time today, the crypto market structure flashes a bullish trend reversal as the bears dropped the coin price to a low of $0.0000214 level above the EMA-50, indicating a bullish trend and also proving that the buy traders are still in control of the market.
Therefore, the Lucky Block pair could signal a bullish trend reversal if buyers can increase their buying activities in the market to rally up to a significant level. The crypto price may reverse from the $0.0000214 support and swing to retest the $0.0000450 previous high, bolstering the bullish momentum for a higher recovery.
Further, the Lucky Block market flashes a bullish trend reversal as the pair has fallen to the oversold region of the daily stochastic. It implies that the selling pressure is likely to end soon.
As a result, buyers would be compelled to resume sooner and the next bullish trend reversal pattern may extend to the $0.0001200 high mark in no long time in its long-term perspective.
LBLOCKUSD Medium-term Trend: Bearish (4H Chart)
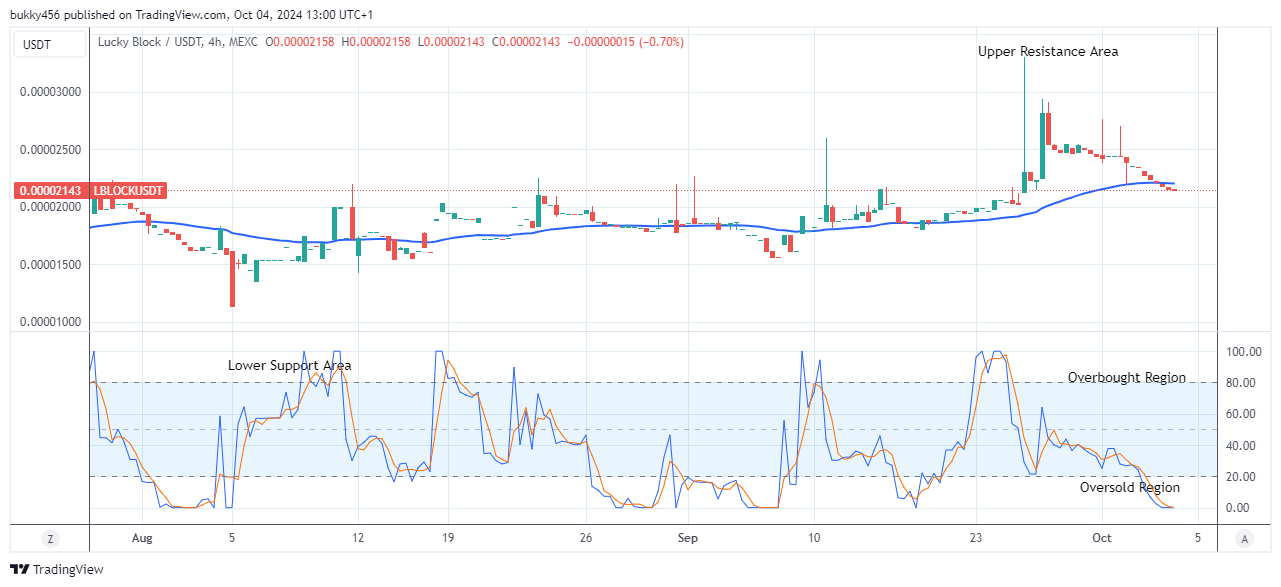
The LBLOCKUSD pair flashes a bullish trend reversal on the medium-term chart as the price remains below the supply levels, showing a downward movement. This is clear as the price continues to make lower highs and lower lows. All eyes are glued on the $0.0000330 level, but sellers’ congestion at $0.0000214 has become impenetrable. 
At the press time, as anticipation builds for the upcoming surge, the Lucky Block pair flashes a bullish trend reversal as the bearish action drops the crypto price low to a $0.0000214 level below the EMA-50 as the 4-hourly session resumes today. Nevertheless, traders might seize this opportunity to invest in the coin at a lower rate and look for more gains ahead.
However, suppose a renewed surge in buying interest occurs. In that case, the LBLOCKUSD pair may experience a bullish trend reversal at the $0.0000214 current support to hit the $0.0000450 barrier level, providing buyers with a solid entry point.
Notably, the Lucky Block pair has fallen below the 20% range of the daily stochastic, indicating that the pair is now in the oversold region of the market. The selling pressure is likely to subside soon, and we will now be looking into the emergence of buyers in the oversold region of the market.
As a result, the price could pump or surge upsides to hit the $0.0001200 resistance value as soon as the pair flashes a bullish trend reversal in its medium-term outlook.
You can purchase Lucky Block here. Buy LBLOCK


Leave a Reply