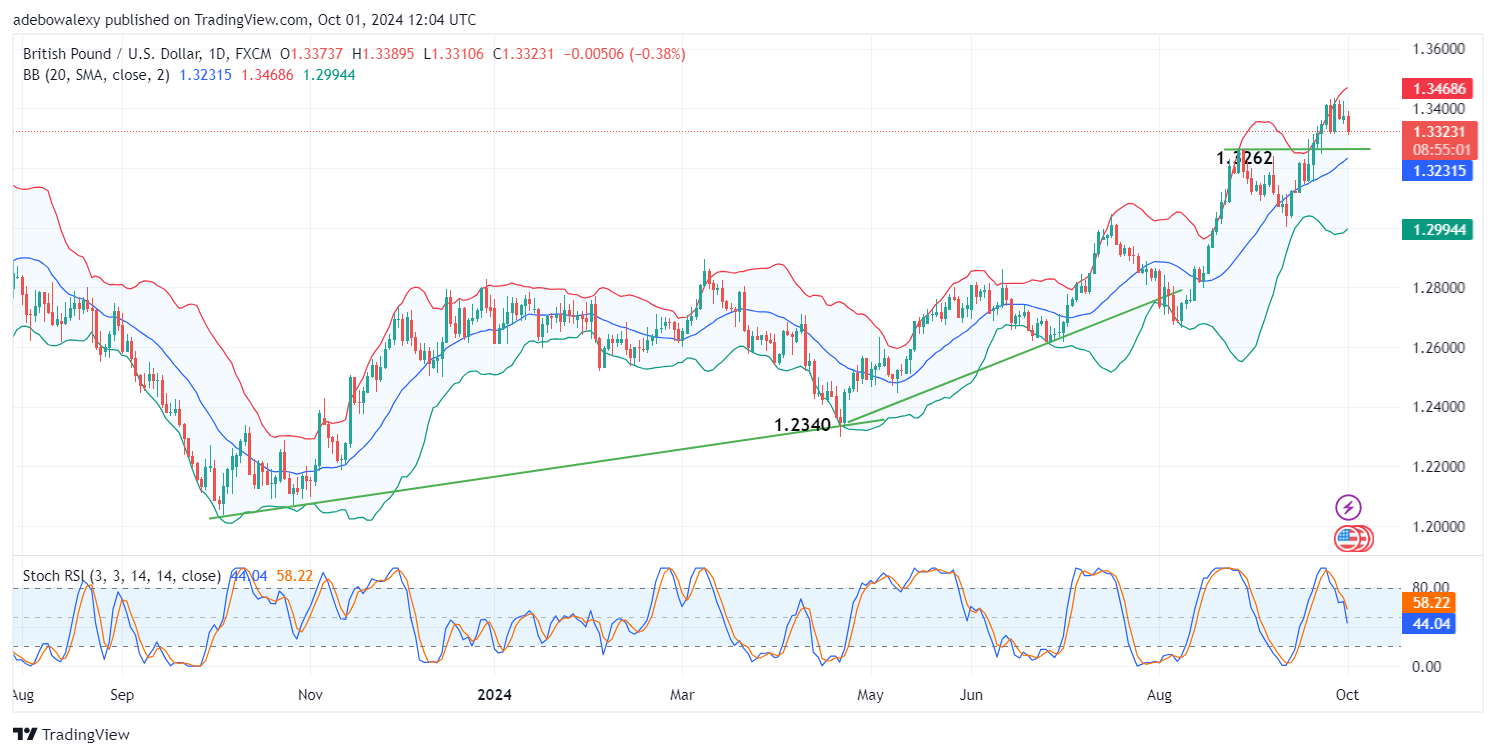
The GBP/USD has encountered a strong barrier in its upward trajectory, which can be seen as price activity could not break through the 1.3400 threshold. Meanwhile, the general market anticipates an array of fundamentals that may excite the USD, further dictating price direction in this market.
Key Price Levels:
Resistance Levels: 1.3400, 1.3600, 1.3800
Support Levels: 1.3200, 1.3000, 1.2800

GBP/USD Eyes Nearby Support as Dollar Strengthens
After price activity in the GBP/USD daily market pushed through the 1.3400 mark, bulls seem to have started taking profits, resulting in the market’s failure to progress further. At this point, a myriad of well-anticipated fundamentals lie ahead for the US dollar.
This, combined with market sentiment, has produced a moderate downward price retracement. Despite the retracement, it can be observed that the pair still trades above the middle line of the Bollinger Bands (BB) indicator. Also, the Stochastic Relative Strength Index lines can be seen trending downward toward the oversold region.

GBP/USD Begins a Downward Retracement
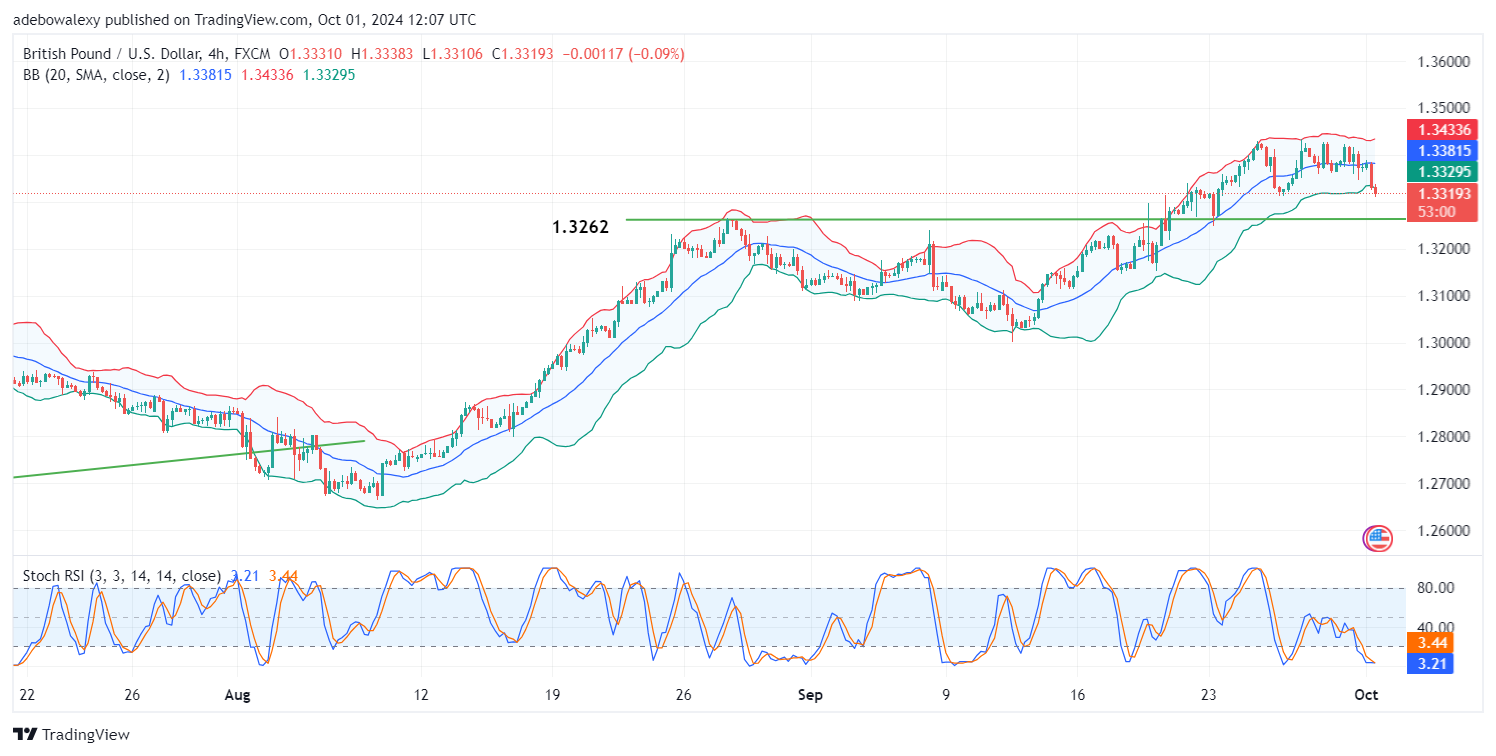
The GBP/USD 4-hour market has signaled that the downward retracement may be quite strong. The last price candle could be seen pushing toward the lowest limit of the BB indicator.
This could have resulted in an upward rebound, but it seems fundamentals are exerting bearish pressure on the market ahead of important economic data from the US. As a result, the Stochastic RSI indicator lines can be seen moving sideways in the oversold region. This dragging effect will allow bearish traders to reap more gains, at least toward the support at the 1.3262 price level.
Do you want to take your trading to the next level? Join the best platform for that here.


Leave a Reply