Lucky Block Price Prediction – July 26
The LBLOCKUSD price will move higher as revealed by the technical indicator, showing the pair is in an uptrend. Therefore, if all the support levels hold and the bulls trigger their forces in the market, the coin price may likely break from the 4-hourly $0.0000190 high value to retest the $0.0000745 previous barrier level which might extend to a $0.0001200 resistance trend line, indicating a robust growth in Lucky Block’s network.
Key Levels:
Resistance levels: $0.0000350, $0.0000400, $0.0000450
Support levels: $0.0000180, $0.0000170, $0.0000160
LBLOCKUSD Long-term Trend: Bearish (Daily Chart)
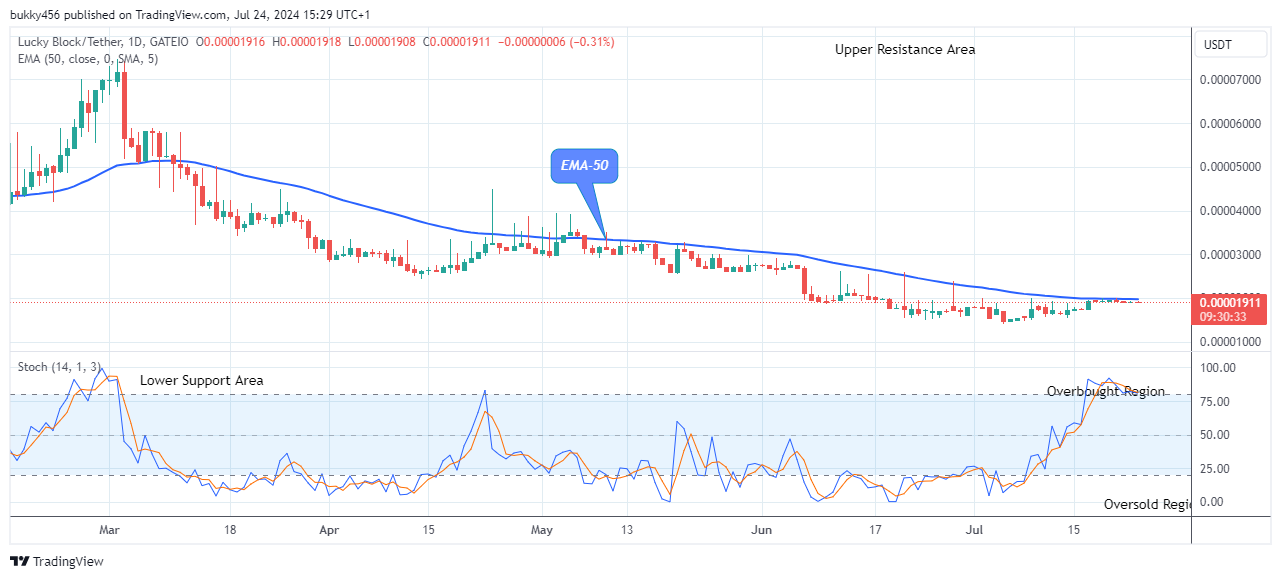
LBLOCKUSD price will move higher as shown by the price signal pointing upwards on the daily chart. The price bar is slightly below the EMA-50, confirming its bearish trend. 
The interactions from the bears at the $0.0000191 low value in the previous action have contributed to its bearishness in its recent low.
Actions from the bears further dropped the Lucky Block price to the $0.0000190 support level below the EMA-50, as the daily chart resumes today.
Therefore, if the current support holds and the bulls step up their market activity, the bullish momentum may be set off and the price will move higher to break up the previous high value of $0.0000745, offering a good entry opportunity for coin buyers.
In addition, the LBLOCKUSD price can move higher as soon, as the price projector points upwards, indicating an uphill momentum.
Thus, a price retracement from the $0.0000190 current support level to retest the $0.0000745 is possible, which may extend to a $0.0001200 upper resistance level, suggesting growing confidence among investors as the coin price moves higher in its long-term perspective.
LBLOCKUSD Medium-term Trend: Bullish (4H Chart)
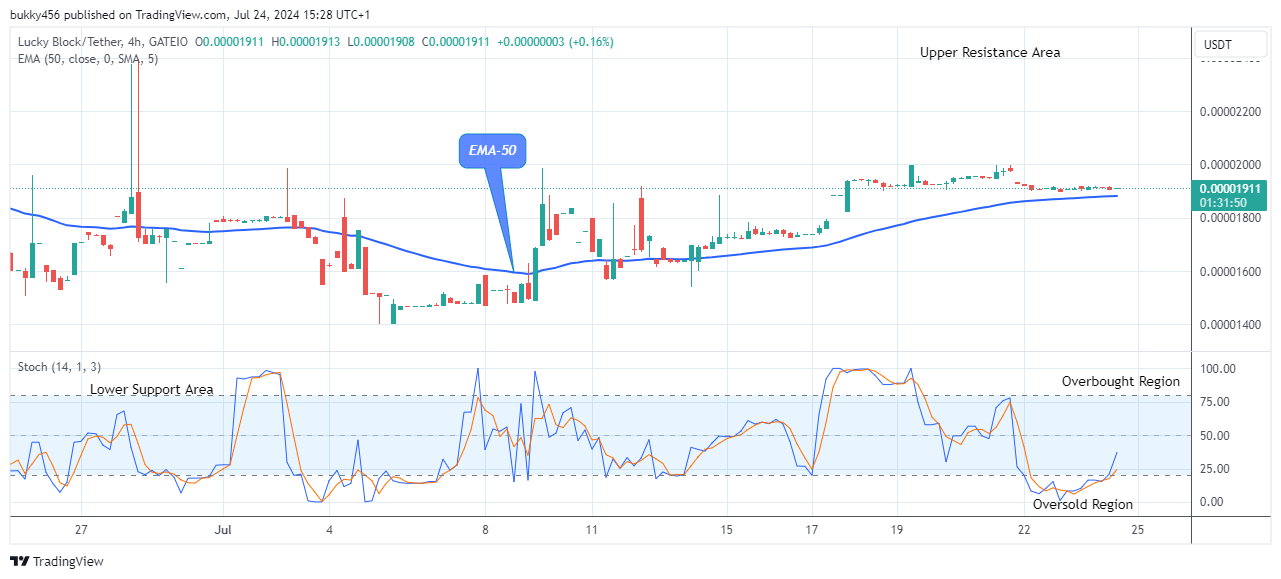
Despite the interference by the short traders, the LBLOCKUSD price suggests that the price will move higher and remain in a bullish trend zone in its medium-term outlook. The price bar is above the EMA-50, indicating an uptrend.
The coin market value which rises significantly to a high at $0.0000191 resistance level above the EMA-50 as the 4-hour chart opens today affirms the presence of more bulls in the market which will possibly lead to more intraday gains for the buy investors.
Further, the momentum indicator shows that the coin price will move higher by pointing upwards. It implies that the price of Lucky Block will continue to move higher and may reach the $0.00012 move higher to a strong bullish zone soon in its medium-term view.
You can purchase Lucky Block here. Buy LBLOCK
Learn to Trade Forex Online
Lucky Block Price Prediction: LBLOCKUSD Price Will Move Higher
Footer

ForexSchoolOnline.com helps individual traders learn how to trade the Forex market
WARNING: The content on this site should not be considered investment advice and we are not authorised to provide investment advice. Nothing on this website is an endorsement or recommendation of a particular trading strategy or investment decision. The information on this website is general in nature so you must consider the information in light of your objectives, financial situation and needs.
Investing is speculative. When investing your capital is at risk. This site is not intended for use in jurisdictions in which the trading or investments described are prohibited and should only be used by such persons and in such ways as are legally permitted. Your investment may not qualify for investor protection in your country or state of residence, so please conduct your own due diligence or obtain advice where necessary. This website is free for you to use but we may receive a commission from the companies we feature on this site.
We Introduce people to the world of currency trading. and provide educational content to help them learn how to become profitable traders. we're also a community of traders that support each other on our daily trading journey
Forexschoolonline.com is not a financial advisor. Do your research before investing your funds in any financial asset or presented product or event. We are not responsible for your investing results.

Leave a Reply