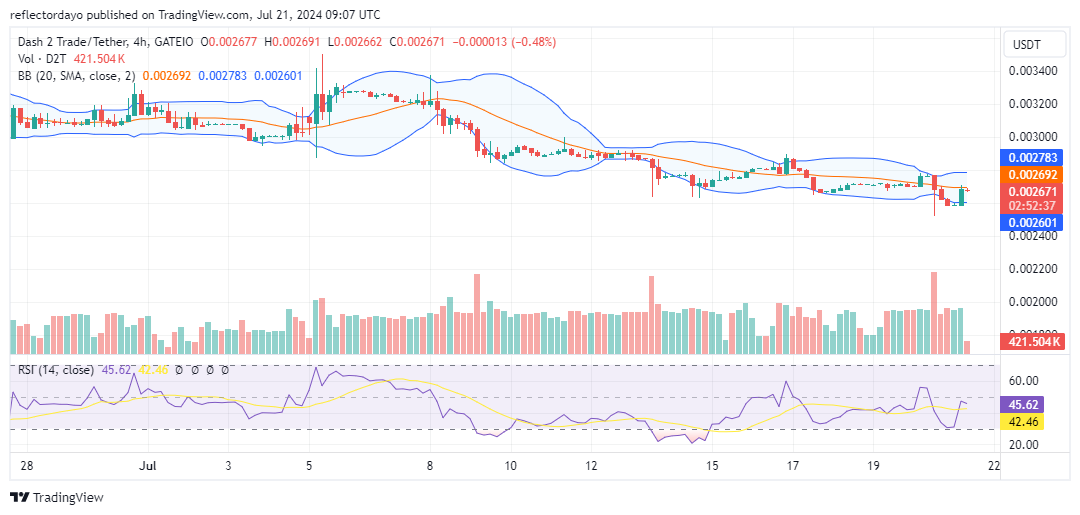
The D2T/USD market is making a significant effort to rally. In the most recent trading session, bulls dominated a substantial portion of the activity. However, at the $0.0027 price level, the market encountered resistance. As a result, the bullish momentum was rejected, causing the price to begin retracing to a key support level.
Key Levels to Watch:
- Resistance: $0.015, $0.016, and $0.017
- Support: $0.0020, $0.0018, and $0.0017

Dash 2 Trade Price Analysis: The Indicators’ Point of View
The emergence of a resistance level at $0.0027 has put pressure on the bullish position. Bullish traders need to reinforce their hold at the $0.0025 level, which now serves as a formidable support. Traders appear willing to buy at this price, adopting a bullish bias. However, while the market action seems to be ranging sideways, a broader view reveals a downward trend. If the D2T/USD bulls can break above the $0.0027 resistance, the market sentiment may shift, potentially leading to significant price gains.

D2T/USD Short-Term Outlook: 1-Hour Chart
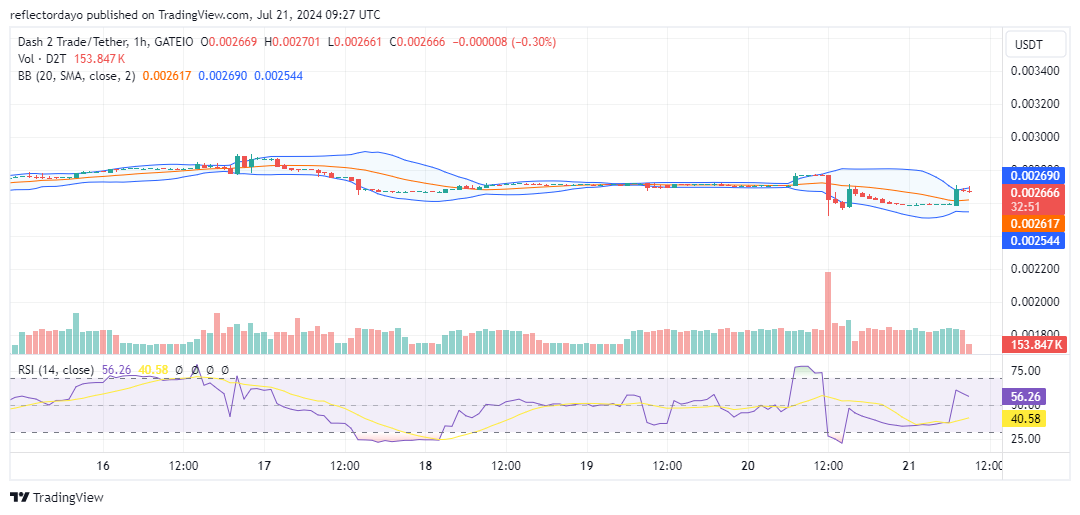
From the perspective of the 1-hour chart, the bulls are holding steady around the $0.00267 price level. This stability has persisted for the past two sessions. If this trend continues, the $0.0027 resistance level may be easily broken, potentially leading to the next stop at $0.0028. The Bollinger Bands indicate growing bullish activity, as the upper band of the indicator begins to diverge upward.


Leave a Reply