Tamadoge Price Prediction – July 18
It has been overly demonstrated that buying activities have continually be to rebuild catalysts from a considerable lower zone in the TAMA/USD trades, as the crypto-economic market has been seen having spiking signs, finding basis around the point of $0.002.
It has been believed that the lower Bollinger Band trend line would play a key role in the events that will enable buyers to regain strong yearning entry. To continue pursuing that idea, $0.002 must continue to be the important trading locations for creating a foothold following the observation of a noteworthy all-time low value.
TAMA/USD Market
Key Levels
Resistance levels: $0.003, $0.004, $0.005
Support levels: $0.002, $0.0015, $0.001
TAMA/USD Medium-term Chart
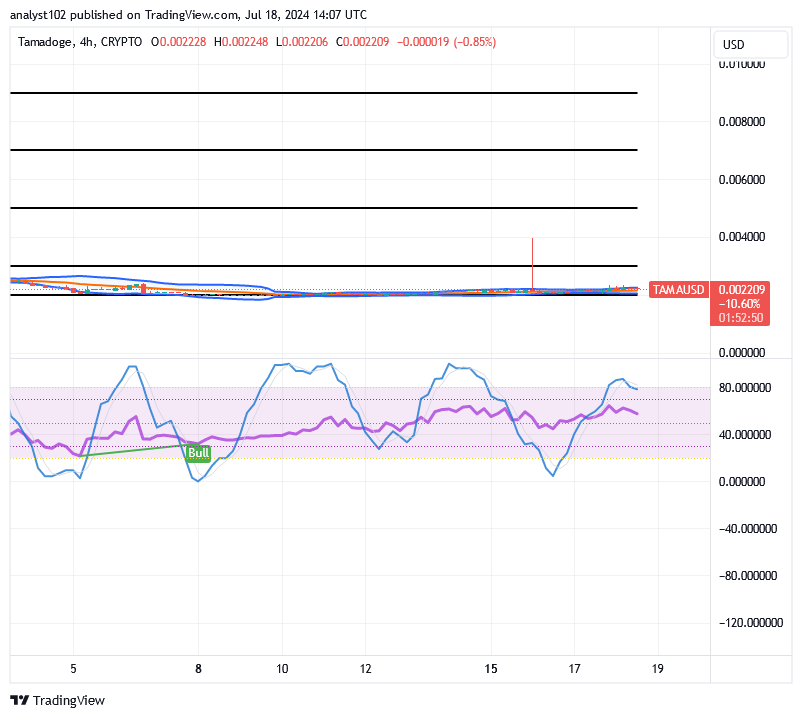
The TAMA/USD medium-term chart showcases that the crypto-economic market has spiking signs, finding a basis around $0.002.
The trend lines of the Bollinger Bands have been moving eastward, positioning the value line of $0.002 as the critical point. To maintain their position in the overbought area, the stochastic oscillators have advanced northward.
Is there any reason not to keep securing additional declines in the TAMA/USD market below the $0.002 mark?
Logically speaking, it is a great opportunity to stake proceedings of dips in an emerging crypto economy like Tamacoin against the use of the American currency, given that the price now has been spiking, finding a basis around $0.002.
Regarding Tamadoge’s aftermath market value, the general consensus is that it will eventually recover and be able to make up for the majority of the greater equity values that it lost. Should that be the case, investors should continue to revisit the addition of a few points even as the price starts to drop. 
The TAMA/USD short-term
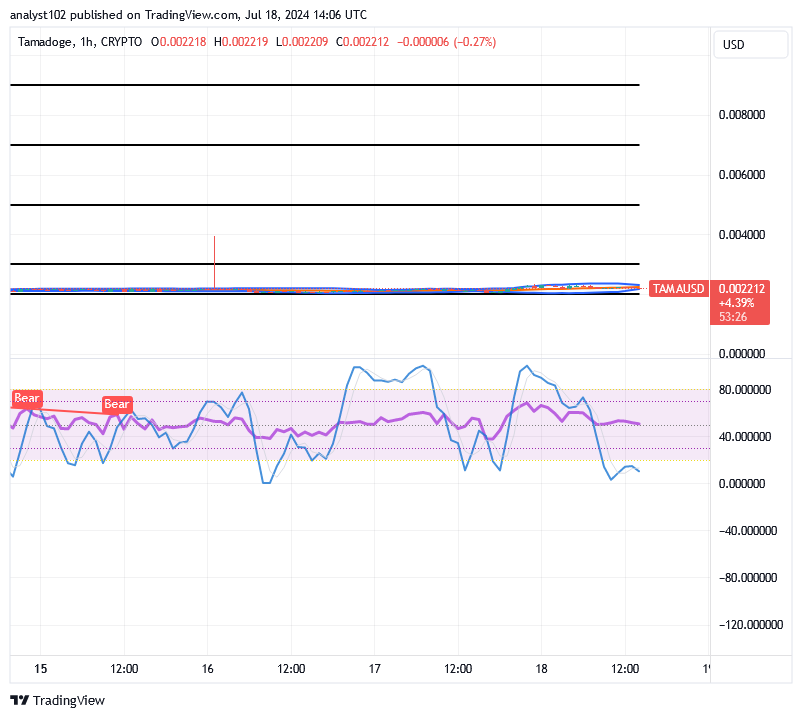
The TAMA/USD short-term chart shows that the crypto-economic market is spiking and finding a basis, using $0.002 as a threshold.
From the perspective of hourly analysis, the stochastic oscillators have moved southward and entered the oversold area, indicating that the selling force is essentially at a reduction stage. The trend lines of the Bollinger Bands are positioned around the $0.002 value line, aiming to be just above the point. However, they are all oriented toward the east, indicating a sideways move in the market.
Let the mayhem start again!
Your chance to shine is here as the leaderboard has reset!
Play, scale, and take home some TAMA!
Let the chaos recommence! 🐕 💨
— TAMADOGE (@Tamadogecoin) July 18, 2024
The leaderboard has reset and it’s now your time to shine! 😎 ☀️
Play, climb, and win some $TAMA!
Download here:
📱 Android: https://t.co/D4TjX7gTFl
📱 iOS: https://t.co/0fjJapf5oA#Tamadoge #CryptoGaming #P2E pic.twitter.com/ZsEbIeEqdt
Do you want a coin that would 100X in the next few months? That is Tamadoge. Buy TAMA today
Note: Forexschoolonline.com is a financial advisor. Do your research before investing your funds in any financial asset or presented product or event. We are not responsible for your investing results.


Leave a Reply