USDCAD dived as the US PMI arrived poor. The pair have already been experiencing counterbalancing effects from both sides of the market, which limited price movement earlier in the session. However, headwinds seem to have gained the upper hand with the US PMI, as bears capitalize on this to print considerable profits.
Key Price Levels:
Resistance Levels: 1.3700, 1.3800, and 1.3900
Support Levels: 1.3600, 1.3500, and 1.3400

USDCAD Downward Corrections Seem Volatile
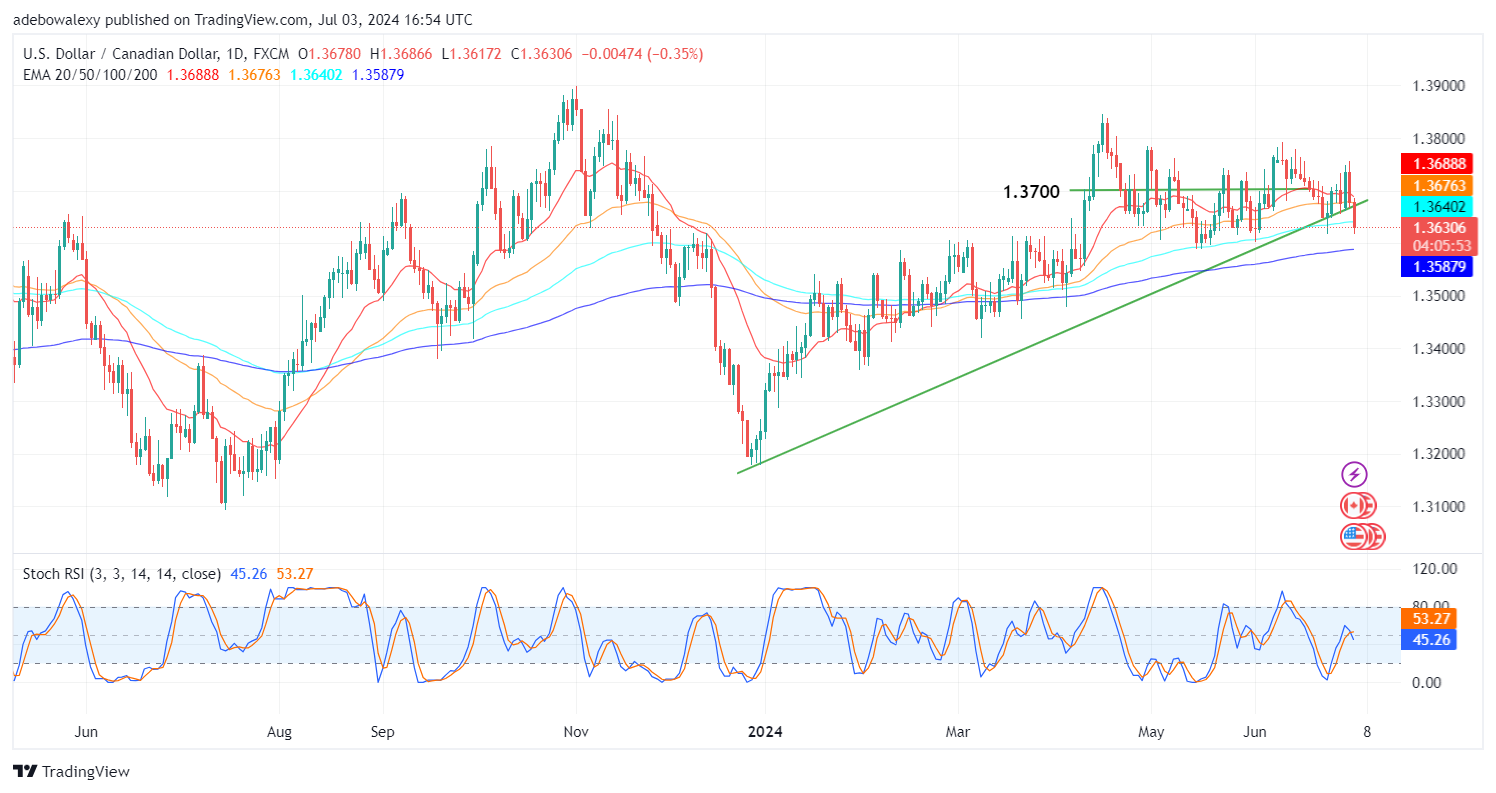
Ever since price action in the USDCAD daily market popped through the 1.3700 ceilings, the market has witnessed a sharp reversal below that psychological price level. This has effectively placed the pair below the 20, 50, and 100-day Exponential Moving Average (EMA) lines.
Likewise, the Stochastic Relative Strength Index (RSI) lines have delivered a crossover around the 50 level of the indicator. At this point, the lines are still projected sideways, but the direction of price movement in this market seems almost clear already. This can be derived from the position of the pair below most of the EMA lines.
USDCAD Eyes the Technical Support at the 1.3600 Mark
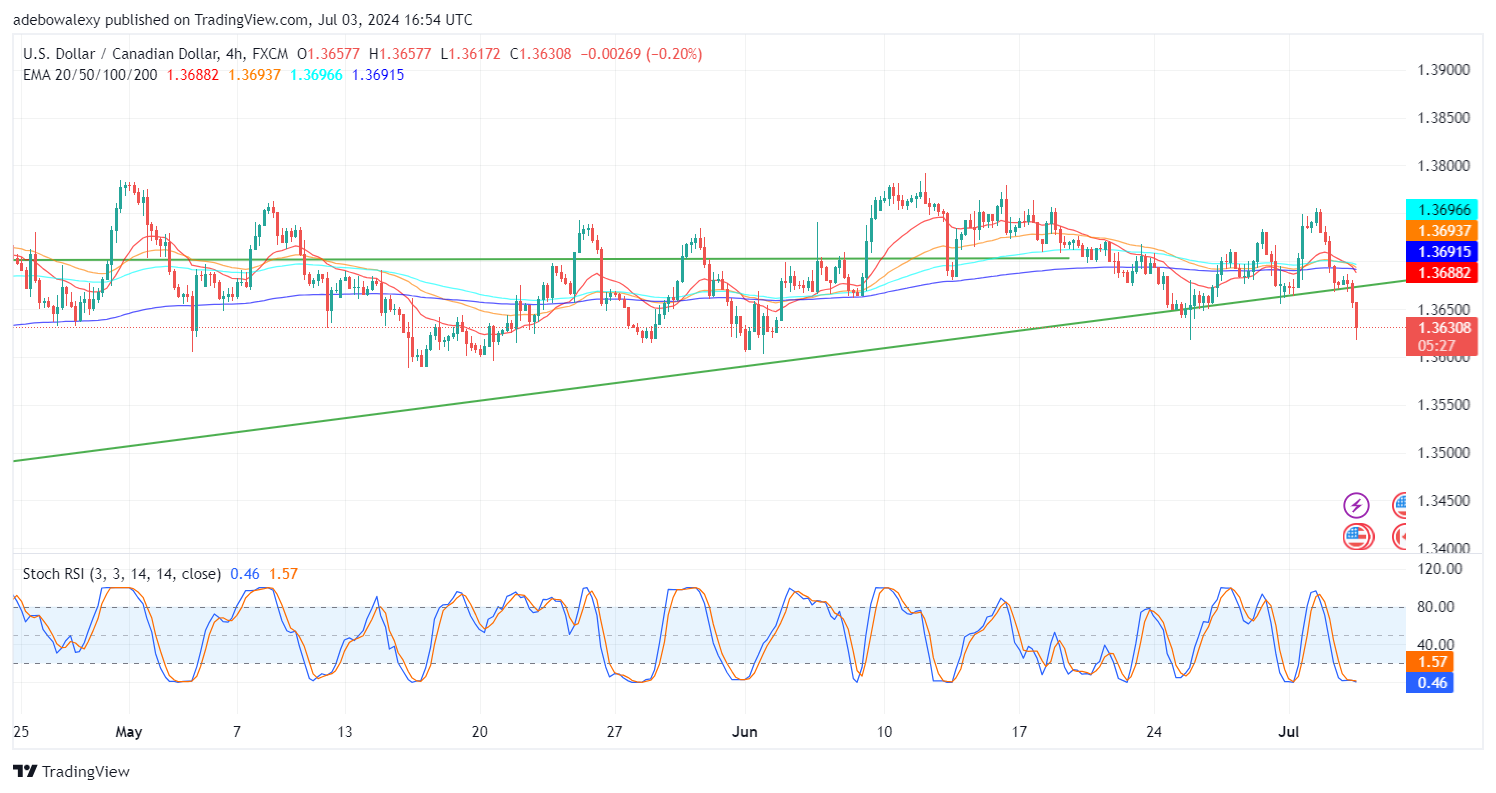
Price action in the USDCAD market has plunged further below the drawn upside-sloping trend line on the 4-hour price chart. The pair is also trading below all the EMA lines of the indicator.
Furthermore, all the lines of the EMA indicator appear to be converging toward a bearish crossover. This confers a strong bearish characteristic on the market, which may cause it to hit the 1.3600 price level. Nevertheless, traders may focus on the US FOMC data for guidance on whether the market will hit the 1.3600 level or even lower.
Do you want to take your trading to the next level? Join the best platform for that here:


Leave a Reply