Tamadoge Price Prediction – July 3
There have been continual proceedings of holding promissory positive pushes in the trade activities that characterize the presence of bull and bear in Tamacoin versus the valuation of the US Dollar, given that the crypto market presently presses flat below $0.003, making bounce signals.
The oscillation tools have shown a great deal of energy depletion, demonstrating that long-position pushers have been able to consistently hold the market tempo against free fall-offs approaching the underlying support line of $0.002. Having said that, the market has now compressed somewhat to the south, positioning the present barrier zone beneath the line of $0.003, which price must cross to indicate the start of a trend back upward.
TAMA/USD Market
Key Levels
Resistance levels: $0.004, $0.006, $0.008
Support levels: $0.002, $0.0015, $0.001
TAMA/USD Medium-term Chart
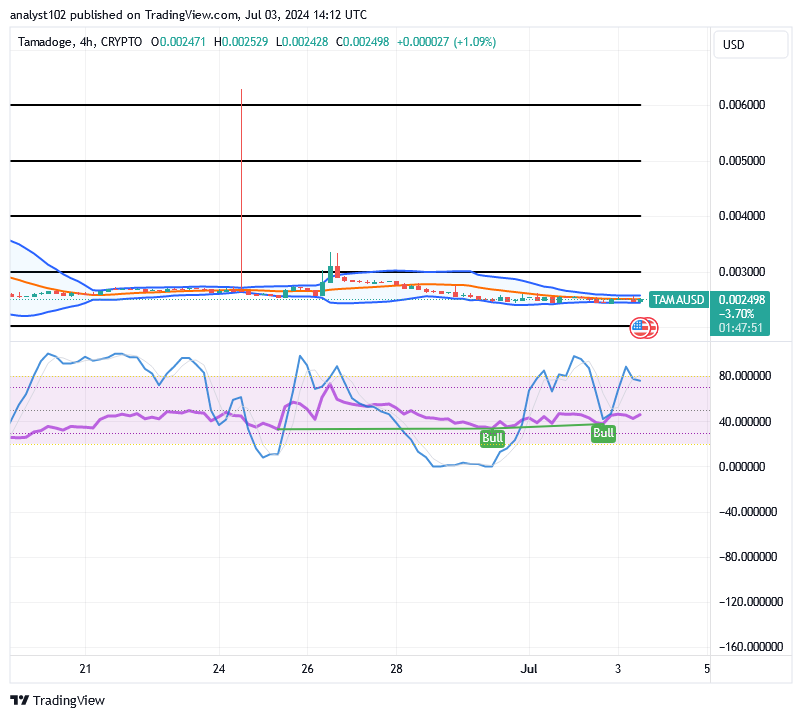
The TAMA/USD medium-term chart showcases that the crypto market presses flat in the east direction, making inputs bounce.
Following the variation candlestick formation, the Bollinger Bands trend lines have continued to expand in a range-bound fashion. The blue trend line of the stochastic oscillators has veered into the overbought area. Since the candlesticks have stayed at lower highs and lows, it is likely that prices will make steady entry at the lower ends.
Considering the market’s impulse presently, should the TAMA/USD market bulls hold out of the transaction lines for a while?
It won’t technically be a good trade thought for long-position movers to move out of the market currently, as the TAMA/USD market presses flat, making bounce signals within the points of $0.003 and $0.002.
By utilizing a lower chart, say 15 minutes, the present trading zones will be able to produce excellent long-term position orders more easily. The price of the developing crypto economy has been devalued for a while, so the staking position orders may go forward despite the indicators’ positioning postures.
The TAMA/USD short-term
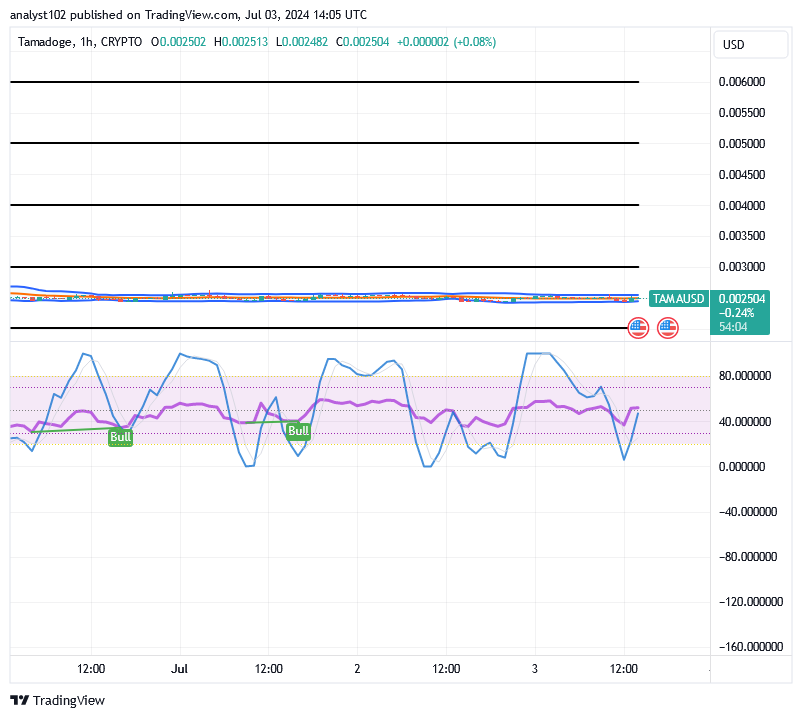
The TAMA/USD short-term chart shows that the crypto-economic market presses flat, making bounce signals.
The stochastic oscillators have been consistently swerving up and down through variant lines with positive signs. The Bollinger Bands trend lines have kept moving flatly at close ranges to the east to signify that neither buyer nor seller has a definite approach to the market. However, we do not recommend placing shorting position orders around the formation pattern of the indicators.
Take part in the Tamaverse and win!
This is your final opportunity of the week to demonstrate your abilities and receive some delicious TAMA prizes.
Play & Earn in the Tamaverse! 🙌
— TAMADOGE (@Tamadogecoin) July 3, 2024
This is your last chance for the week to showcase your skills and earn some sweet $TAMA rewards. 🐶
Leaderboard ends at Midnight UTC! ⏰
Go ⬇️
📱 Android: https://t.co/D4TjX7gTFl
📱 iOS: https://t.co/0fjJapf5oA#Tamadoge #P2E #Crypto pic.twitter.com/WRAlbqNEc5
Do you want a coin that would 100X in the next few months? That is Tamadoge. Buy TAMA today
Note: Forexschoolonline.com is a financial advisor. Do your research before investing your funds in any financial asset or presented product or event. We are not responsible for your investing results.


Leave a Reply