Quant Price Forecast: June 1
The Quant price might break from support and resume its uptrend soon if buyers should trigger their buying pressure and put a hold on the current support level at $90.00, the bulls may prolong the correction to hit the previous high level at $154.75 which perhaps could extend to as high as the $160.00 high level, resulting to a stable recovery and a good signal for the coin buyers.
Key Levels:
Resistance Levels: $93.00, $94.00, $95.00
Support Levels: $85.00, $84.00, $83.00
QNTUSD Long-term Trend: Bearish (Daily chart)
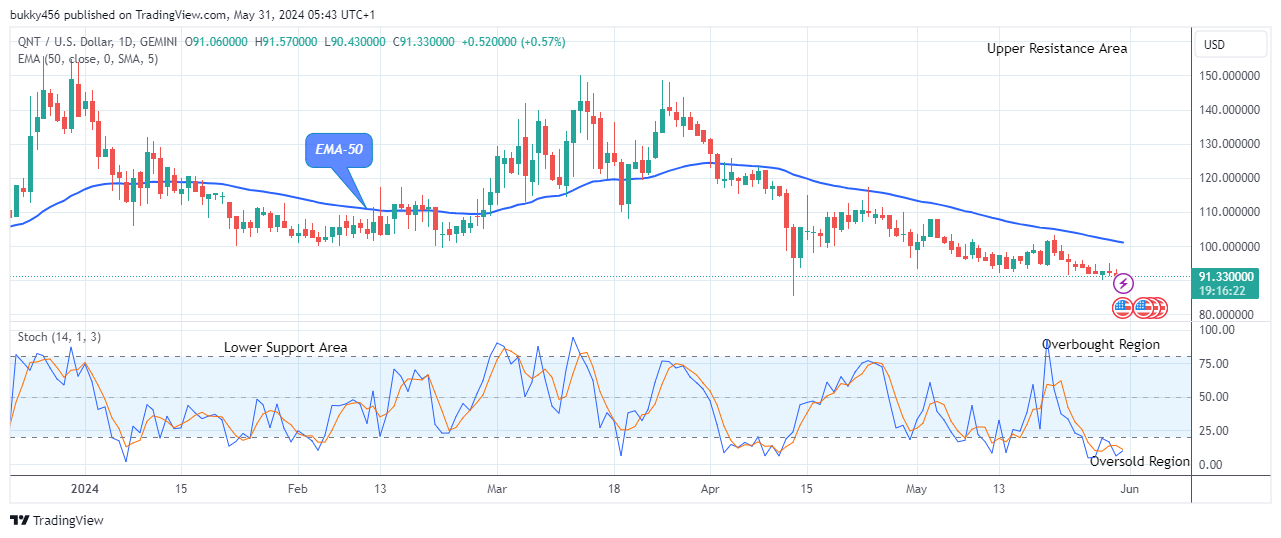
The Quant is in a bearish trend in its long-term view. Meanwhile, the coin price is about to break out from the support level as the new correction is taking place. Further, the price is trading below the moving average which confirms its bearishness.
The price of the cryptocurrency has fallen below the supply trend lines as a result of the bears’ pressure, which brought it to a low of $90.00 during yesterday’s session, but it now appears like the crypto price is ready to break out from the support level to and drive us upward.
The bulls also hindering the market price of QNTUSD from being smashed by the bears made a ride to the $91.57 supply level as a pullback shortly after today’s daily chart opened.
Hence, the bullish momentum might be triggered and the price may likely break out from the current level to retest the previous resistance barrier at $154.75 if the current support remains unmoved and the bulls should speed up their activities in the market.
Additionally, the daily stochastic suggests an uptrend. This indicates a bullish continuation of the upward, which will allow the bulls to continue the current rally and this could break out from the support level to hit the $160.000 resistance threshold or higher in the long-term forecast.
QNTUSD Medium-term Trend: Bearish (4H chart) QNTUSD Price Breaking Out from Support Soon
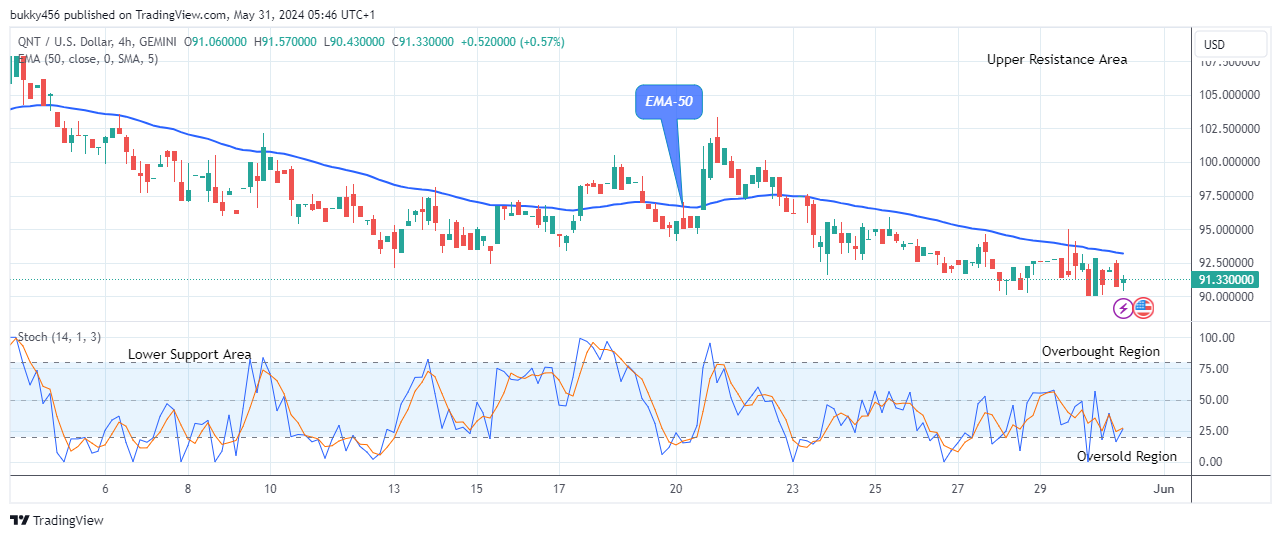
In the medium term, the Quant market is also bearish and may break out from the support level to face the upside soon. This is clear as we can see the prices facing the resistance level below the EMA-50.
The sustained bearish pressure on the currency pair at the $90.81 supply level during the last session sustained it. This has made it easier for the coin to remain in an uptrend in its recent high.
Now, the bulls couldn’t relent, so the current price at the $91.57 supply level below the EMA-50 as the 4-hourly chart begins today is an indication of the bulls’ return to the market to breakout from support and resume the uptrend.
A strong push by the long traders above the $107.85 previous high point with a 4-hour candle closing could signify a shift in the market dynamics. Such a breakout would provide an opportunity for buyers to regain control and potentially drive the price of QNTUSD toward the upper resistance level.
Adding to that, the Quant market remains in an uptrend on the daily stochastic. Thus, there is a possibility of a bullish breakout from the $91.57 current supply level if the bulls should add more effort to their tension in the market. The next target could be the $160.00 supply trend mark in the days to come on the medium-term chart.
Place winning Quant trades with us. Get QNT here
Learn to Trade Forex Online
Quant (QNTUSD) Price to Breakout from Support Soon
Footer

ForexSchoolOnline.com helps individual traders learn how to trade the Forex market
WARNING: The content on this site should not be considered investment advice and we are not authorised to provide investment advice. Nothing on this website is an endorsement or recommendation of a particular trading strategy or investment decision. The information on this website is general in nature so you must consider the information in light of your objectives, financial situation and needs.
Investing is speculative. When investing your capital is at risk. This site is not intended for use in jurisdictions in which the trading or investments described are prohibited and should only be used by such persons and in such ways as are legally permitted. Your investment may not qualify for investor protection in your country or state of residence, so please conduct your own due diligence or obtain advice where necessary. This website is free for you to use but we may receive a commission from the companies we feature on this site.
We Introduce people to the world of currency trading. and provide educational content to help them learn how to become profitable traders. we're also a community of traders that support each other on our daily trading journey
Forexschoolonline.com is not a financial advisor. Do your research before investing your funds in any financial asset or presented product or event. We are not responsible for your investing results.

Leave a Reply