Tamadoge Price Prediction – May 1
Pricing activities that have been featured in the exchange lines that involve Tamadoge versus the valuation of the US Dollar have continued to stage systemically, making the crypto prices hold some lines of spiking.
If bulls don’t add more weights to push the situation into a sudden increase moment early in the process, it has been fairly indicated that a degree of rising forces has been exhausted to a reasonable point, which could cause the pricing system to remain placed underneath the middle Bollinger Band trend line’s resistance capacity for a while. As things stand, the market areas below the $0.006 value line are viewed as extended windows of opportunity to purchase.
TAMA/USD Market
Key Levels
Resistance levels: $0.006, $0.007, $0.008
Support levels: $0.004, $0.0035, $0.003
TAMA/USD Medium-term Chart
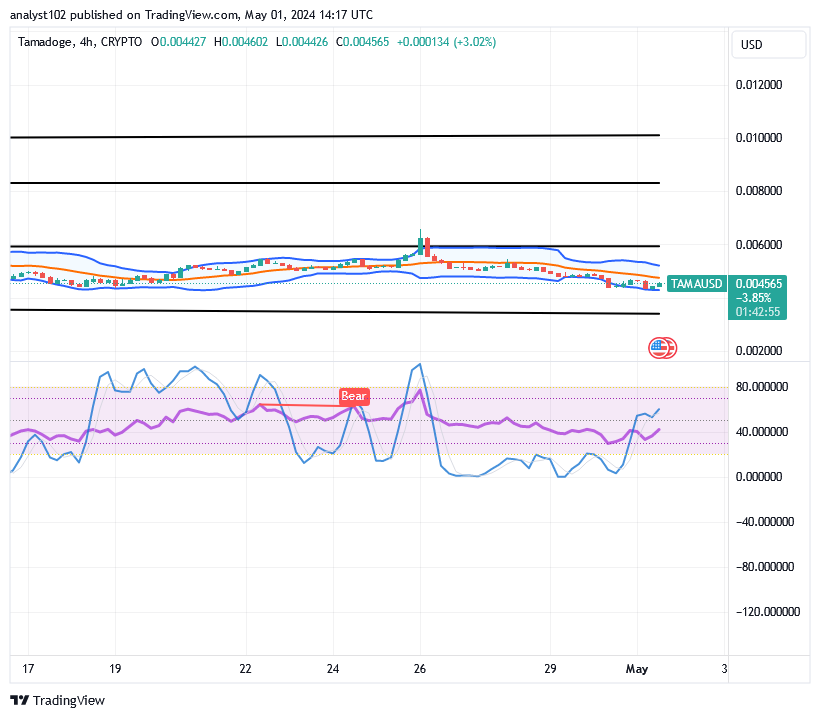
The TAMA/USD medium-term chart reveals that the crypto-economic prices are spiking and staying lowly in compliance with the lower indicator.
The stochastic oscillators have had difficulty moving northward across the red area, suggesting that buyers are exerting some effort to make a comeback. Above the $0.004 line, the Bollinger Band trend lines are slightly bending to the south. Based on the 4-hourly forecast, several promising positive candlesticks have been showing up, indicating that the market is bottoming out before making a number of modest rallies.
Can there still be more lows to be staged below the lower Bollinger Band as the TAMA/USD market trades $0.004565?
As the TAMA/USD market presently bargains around the spot of $0.004565, some positive moving outcomes are being made to instill that long-position pushers are getting ready to outweigh falling sentiments, given that the crypto prices are spiking and staying low.
The majority of sinking moves have been followed by modest surges from the lower Bollinger Band trend line’s trending threshold. It would be the regular habit of investors to make sure that they maintain their positions before they witness market conditions trending upward.
The TAMA/USD short-term
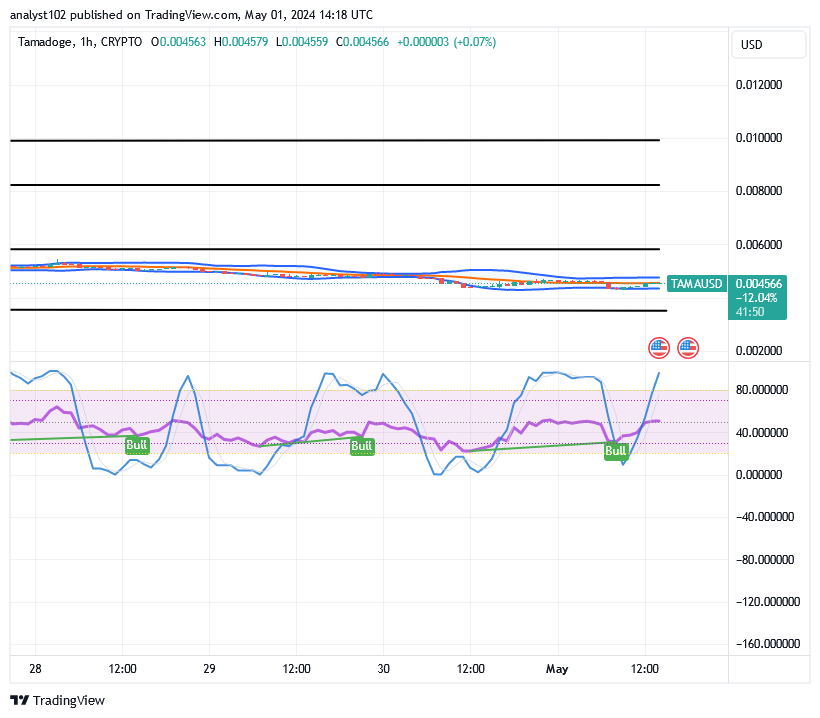
The TAMA/USD short-term chart showcases that crypto-economic prices are spiking and staying low.
The candlesticks’ feature settings have been characterized by a sequence of lower highs that support the likelihood that bulls will shortly stage a comeback. The Bollinger Band indicators are now compelled to be located at or near the $0.005 market line. The oscillators that are stochastic have been excessively veering to the north. Additionally, they are currently situated in an overbought area. Even still, it seems like buyers might benefit greatly in the near future.
Increase your TAMA profits by staking!
The advantages are as follows:
Gain Passively, Have Flexible Access, and Pay Less
🚀 Maximize Your $TAMA Earnings with #Staking! 🎉
— TAMADOGE (@Tamadogecoin) May 1, 2024
Here’s the benefits:
🌱 Earn Passively
🔓 Flexible Access
💸 Low Fees
Download, play, and win:
📱 Android: https://t.co/D4TjX7gTFl
📱 iOS: https://t.co/0fjJapf5oA#Tamadoge #CryptoGaming #P2E #Cryptocurrencies #MATIC pic.twitter.com/baAYLCVmBJ
Do you want a coin that would 100X in the next few months? That is Tamadoge. Buy TAMA today
Note: Forexschoolonline.com it a financial advisor. Do your research before investing your funds in any financial asset or presented product or event. We are not responsible for your investing results.


Leave a Reply