Tamadoge Price Prediction, February 13
Quite a lot of motions have been outpouring to mark variant increases and decreases in the exchange lines of Tamadoge versus the valuation of the US Dollar, as the crypto-economic price floats above $0.004 and stays bouncing around the threshold of the middle Bollinger Band.
As the trade history has shown, the market’s underlying support level is still located around $0.005, with $0.004 acting as a safety net in the event of a more severe decline, while bears may act to impede bulls and force them back into a delay condition before they are able to resume steady rising forces.
TAMA/USD Market
Key Levels
Resistance levels: $0.0070, $0.0080, $0.0090
Support levels: $0.0040, $0.0030, $0.0020
TAMA/USD Medium-term Chart
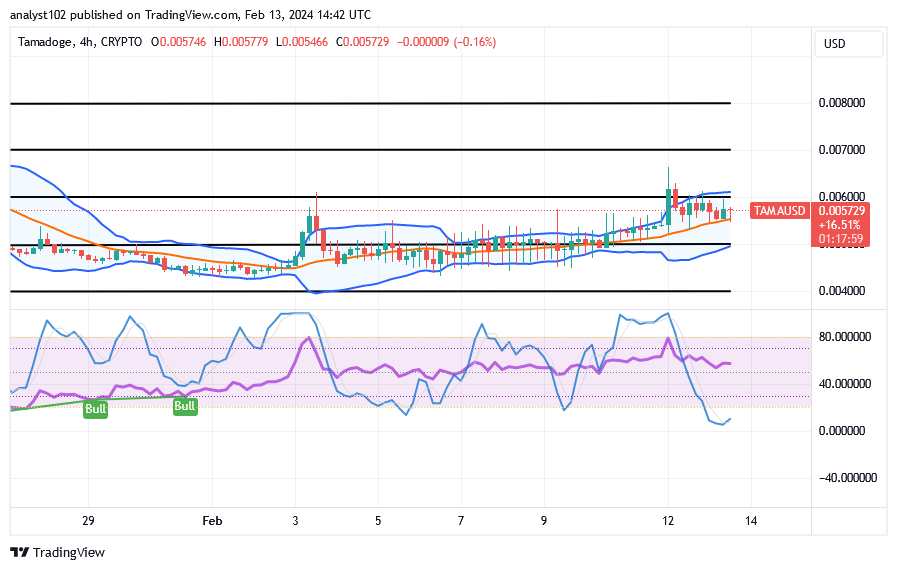
The TAMA/USD medium-term chart reveals that the base crypto instrument floats above $0.004 against the American coin and stays bouncing around the area of the middle Bollinger Band.
The stochastic oscillators have had their one side traversed into the oversold region, denoting that velocities to the downside are probably going to lose weight soon. Variant candlesticks that have formed are being systemically featured around the trend lines of the Bollinger Bands to portray a low-pace placing pattern in the upside direction. 
In the TAMA/USD market, should traders hold off on pushing southerly while the price is trading at $0.005729?
As it has been observed for a while, lesser efforts are expected to be placed on getting more lows in the worth of the TAMA/USD trade, as it has been noticed that the price floats above $0.004 and stays bouncing in the confinement of the Bollinger Bands.
Before a strong rebounding course is produced, the impacts of lesser remaining falls on the market toward or near the trade zone of $0.005 may not aggressively expand to the spot of $0.004. The explanation for this is that bulls’ need to continue with their position-staking strategies regardless of any downward move between the middle and lower Bollinger Band indication zones. 
TAMA/USD short-term chart
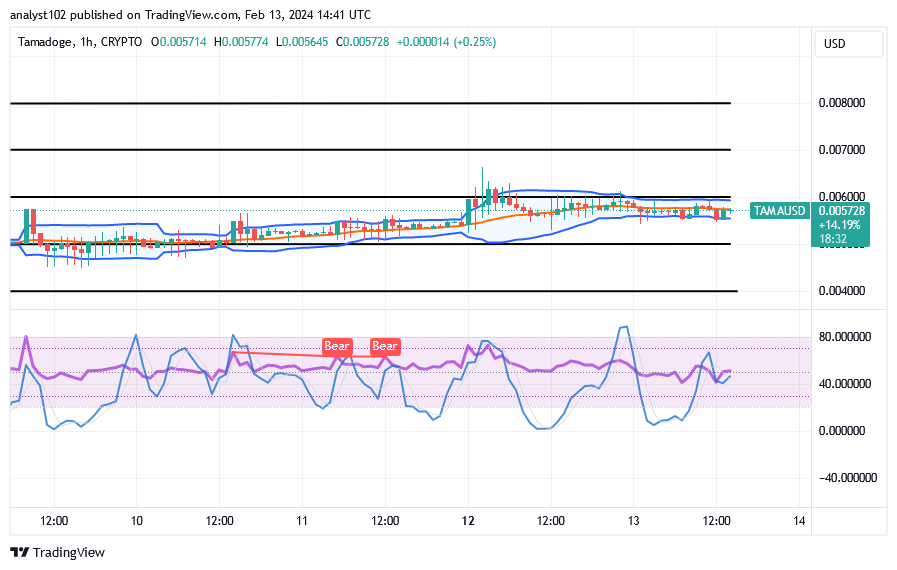
The TAMA/USD short-term chart showcases that the crypto-economic market floats above $0.004 and stays bouncing closely below $0.006.
Even in the vicinity of the Bollinger Band trend lines, the majority of the candlestick formation has supported a rising cryptocurrency signal. At the time of this analysis, the main bargaining locations that the indicators have been pushing eastward have been shown by horizontal lines drawn between $0.006 and $0.005. The stochastic oscillators are arranged in a way that indicates a bullish trajectory that will hold at 40. That suggests that adhering to more buying stances is necessary than choosing to pursue a sale.
Play any Tamadoge game to start earning TAMA right away.
🚨 Last call for this weeks leaderboard 🚨
— TAMADOGE (@Tamadogecoin) January 10, 2024
Get playing any Tamadoge game to earn your $TAMA now 👇
📱 Android: https://t.co/D4TjX7gTFl
📱 iOS: https://t.co/0fjJapf5oA pic.twitter.com/hXBC2PBebJ
Do you want a coin that would 100X in the next few months? That is Tamadoge. Buy TAMA today
Note: Forexschoolonline.com is not a financial advisor. Do your research before investing your funds in any financial asset or presented product or event. We are not responsible for your investing results.


Leave a Reply