Tamadoge Price Prediction, February 2
The impulsive responses on the market operations of the Tamadoge versus the valuation of the US coin showcase that the crypto-economic price is pushing lowly and composing bounces index above the line of $0.0040.
Clear shorting entries have been absent from the dipping process, which has been handled in an unsatisfactory manner.Due to the aforementioned bargaining condition, indecisive cycles may persist for a while, particularly when buyers tend to hold off for additional time. It is not anticipated that sellers will freely move southward beneath the projected baseline of $0.0040.
TAMA/USD Market
Key Levels
Resistance levels: $0.0060, $0.0070, $0.0080
Support levels: $0.0040, $0.0030, $0.0020
TAMA/USD Medium-term Chart
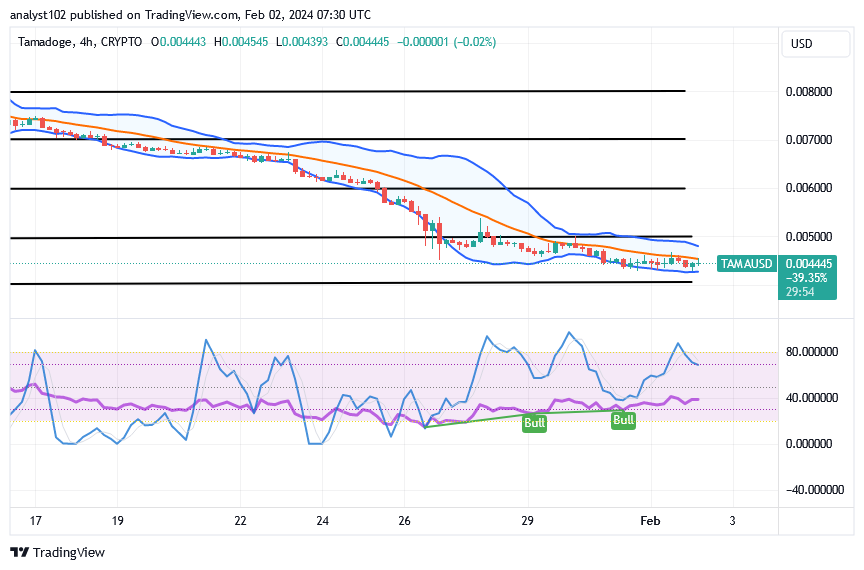
The TAMA/USD medium-term chart reveals that the crypto-economic price pushes lowly beneath the resistance line of $0.0050, composing bounces.
The stochastic oscillators have been actively moving below the line of 80 as it is above the line of the other part to denote that buying pressures are being cultivating to build up to set bulls on probable stable-up rises. The Bollinger Band trend lines have not yet stopped placing southerly in the paints of $0.005 and $0.004.
In a systemic architecture, has there been an index to halt declining forces as the TAMA/USD market hovers around $0.004445?
At this moment, there has been no significant sign to portend the potentiality of ending the way of correction that it has engaged over a couple of times, as the TAMA/USD market pushes lowly, composing bounces.
For 4-hour and 1-hour charts, it would be beneficial to have complementary repositioning states arise in order to predict the potential return of consistent pressures moving northward. The trading support line of $0.0040 shouldn’t be allowed to collapse. Positions staking procedures must be followed even when there hasn’t been a consistent crypto signal on the developing instrument because it’s been placed on an inappropriate downward trajectory.
TAMA/USD short-term chart
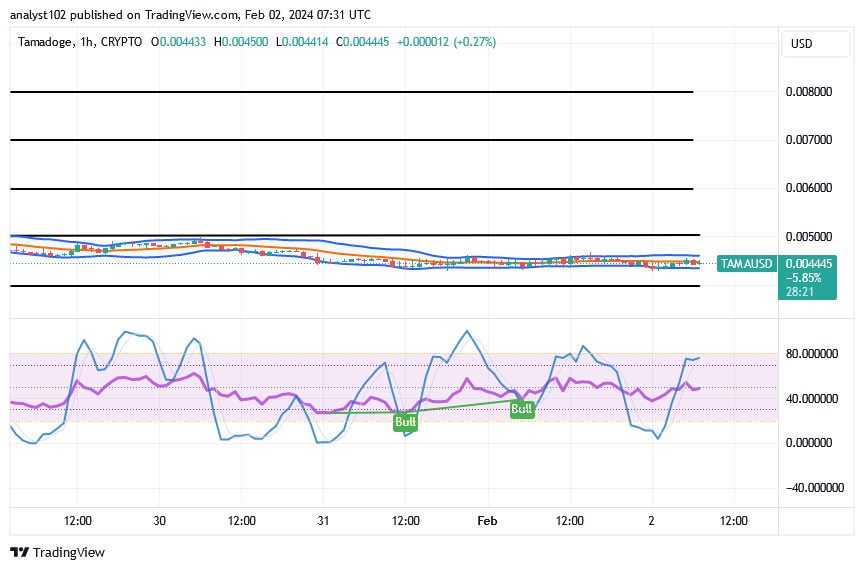
The TAMA/USD short-term chart showcases that the crypto-economic market is pushing lowly, composing bounce signals.
The Bollinger Band trend lines, which constitute bounces, have mostly been positioned on a relative southward pattern in the values of $0.005 and $0.004. The stochastic oscillators are currently positioned around 80, indicating that declining forces are about to enter a progressively lower mode. This information is based on technical analytics. We see that some forces are building up to push back at a later moment that is only in the womb of time as a result of that assumption.
You can get your weekly $TAMA by playing any of our games. You can then stake it in order to grow it even more.
Gaming = Earning
— TAMADOGE (@Tamadogecoin) January 6, 2024
Play any of our games to earn your weekly $TAMA and then stake it to increase it further. pic.twitter.com/RvVihN7jzx
Do you want a coin that would 100X in the next few months? That is Tamadoge. Buy TAMA today
Note: Forexschoolonline.com it a financial advisor. Do your research before investing your funds in any financial asset or presented product or event. We are not responsible for your investing results.


Leave a Reply