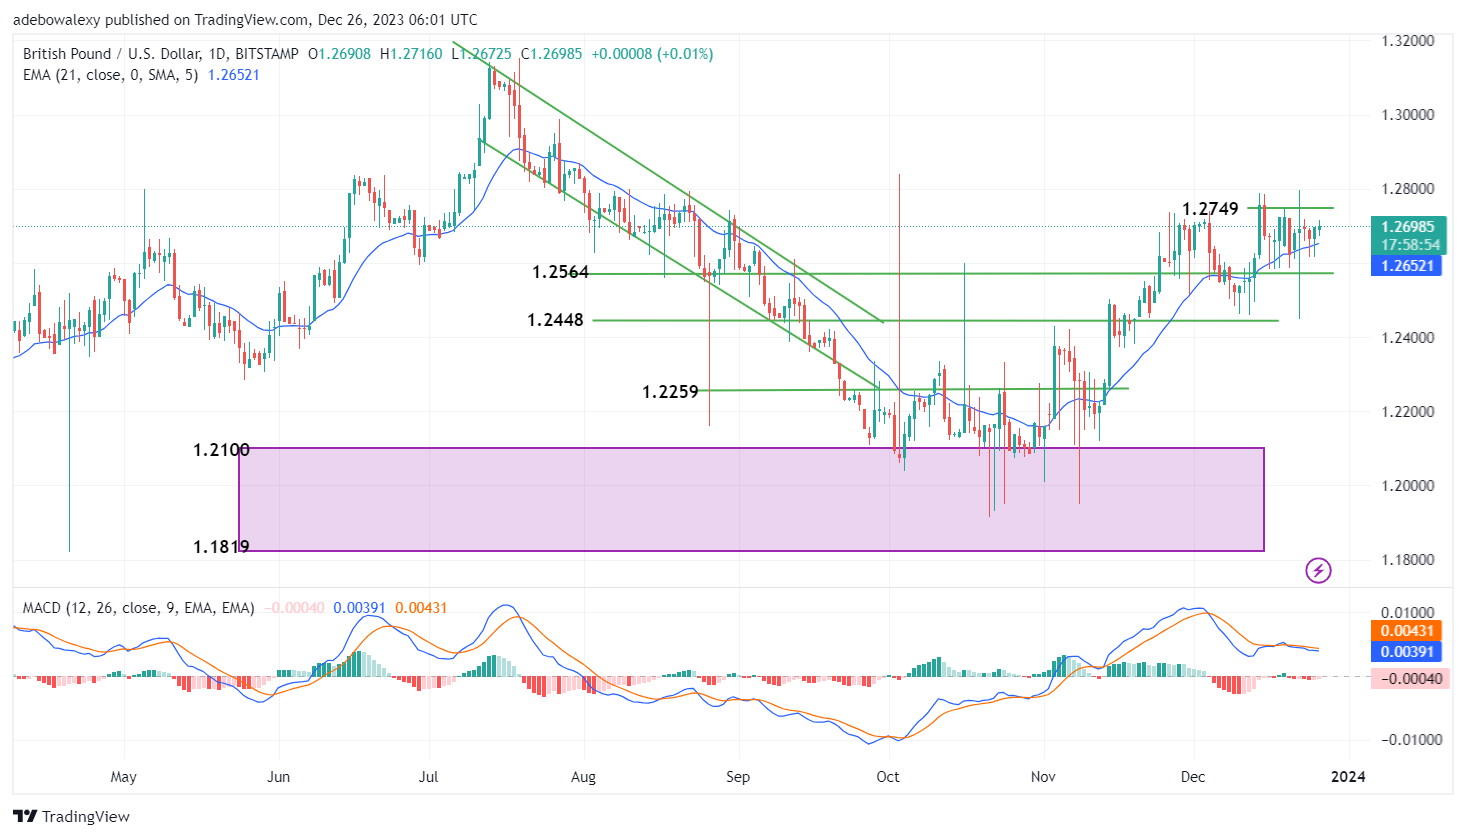
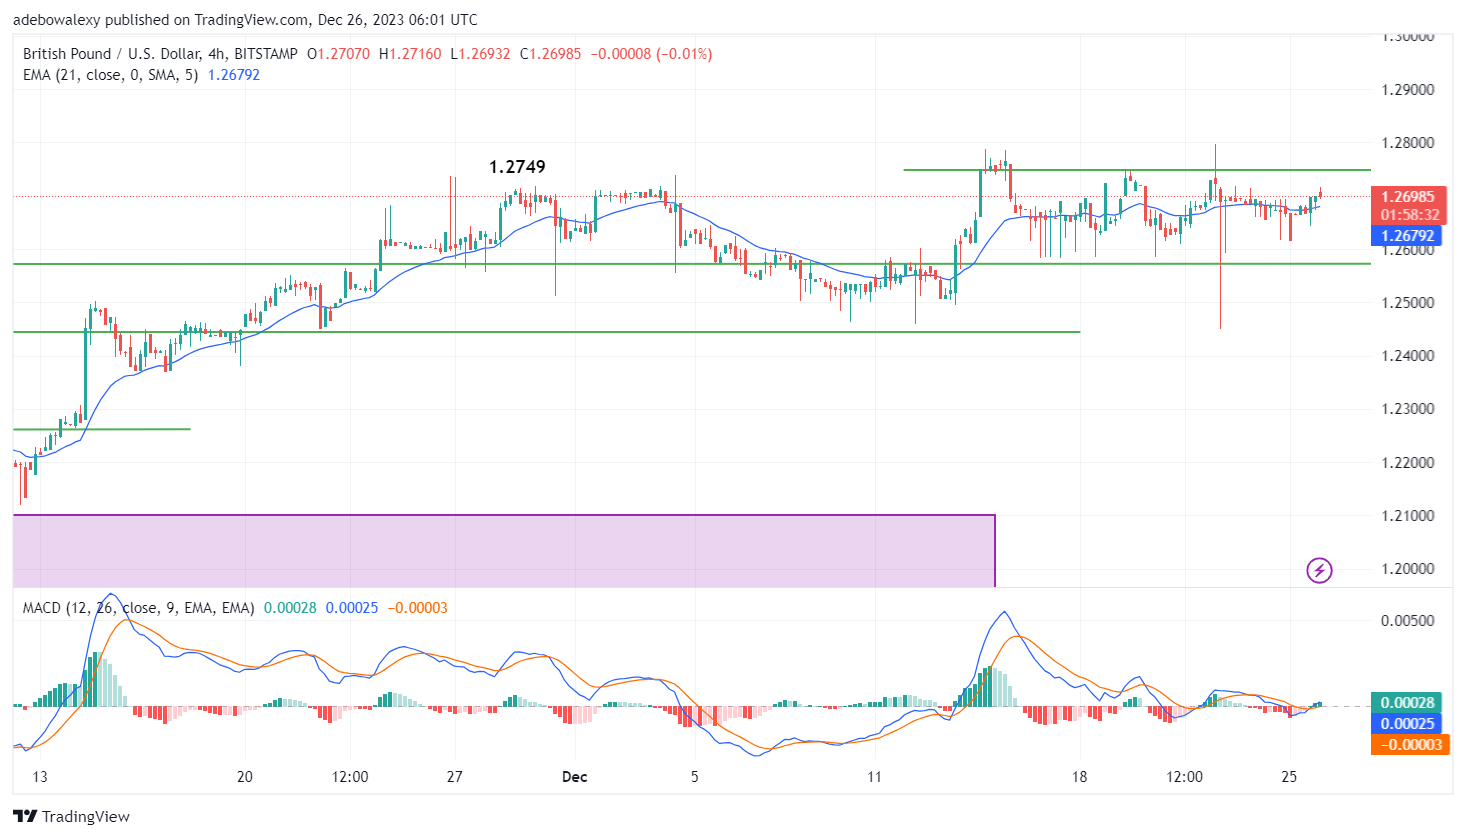
Price movement in the GBPUSD market rebounded downward after hitting resistance at the 1.2700 mark. Thereafter, there was a correction that brought the pair to trade around the 1.2450 mark. However, now, the pair is eyeing a retake of the higher support above the 1.2700 mark.
Key Price Levels:
Resistance Levels: 1.2699, 1.2750, and 1.2800
Support Levels: 1.2650, 1.2600, and 1.2550

GBPUSD Keeps Marching Upwards Above the 21-Day MA Line
Ever since price movement in the GBPUSD daily market poked through the 1.2749 price level, a sharp downward correction resulted. This brought the pair to trade between the 1.2749 price mark and the 21-day Moving Average (MA) line. Consequently, since the pair still trades above the MA line, the market still has a good chances of revisiting more elevated price levels.
The ongoing session seems contracted, as there are equal upper and lower shadows on the corresponding price candle. The Moving Average Convergence Divergence (MACD) indicator lines now seem oriented sideways, while its bars below the equilibrium level are now pale red in appearance. Consequently, this somewhat suggests that buyers may gather more profits since downward forces are weak.

GBPUSD Bullish Indications Stay on Even as Price Action Faces Rejection
In the GBPUSD 4-hour market, we could see that price action is facing some downward rejection. However, technical indicators are still suggesting that upside forces are still viable enough to continue the upside correction. The last price candle above the 21-day MA line is a red one.
Consequently, this suggests that price movement has hit a wall along its path, which has presented a minor downward correction. Despite this, the MACD lines are still coursing upwards above the equilibrium level, while the bars are also appearing above the equilibrium level and are solid green in appearance.
Do you want to take your trading to the next level? Join the best platform for that here.


Leave a Reply