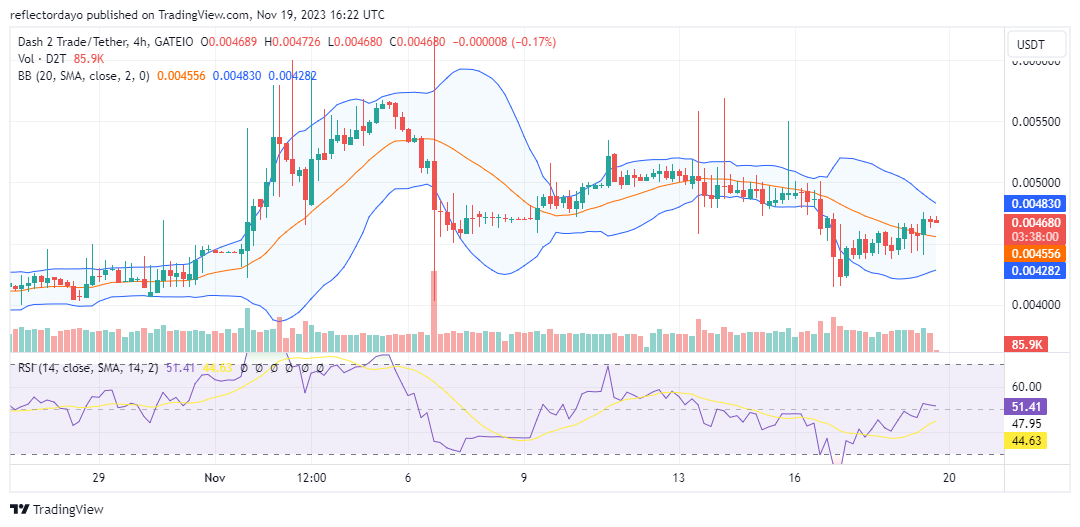
After a period of consolidation around the $0.0049 price level, bearish sentiment prevailed on November 16. The aggressive bear market led to a decline to the low of $0.0042, prompting a bullish market response at this level. D2T/USD bullish traders reacted to this downturn by rallying the price upward.
Key Levels
- Resistance: $0.010, $0.011, and $0.012.
- Support: $0.004, $0.003, and $0.002.

Dash 2 Trade (D2T/USD) Price Analysis: The Indicators’ Point of View
Nevertheless, a primary concern arises as the D2T/USD price takes an upward turn, with its bullish momentum significantly diminishing, thereby impeding the bull market’s effectiveness in confronting the $0.0047 resistance level. Should bears successfully reverse the market’s direction at this point, a lower resistance level may establish itself, potentially prompting bulls to adjust to a lower price level. The Relative Strength Index currently indicates a recovery to the midpoint, signifying a state of equilibrium. Buyers and sellers are currently in a balanced confrontation.

Dash 2 Trade Short-Term Outlook: 1-Hour Chart
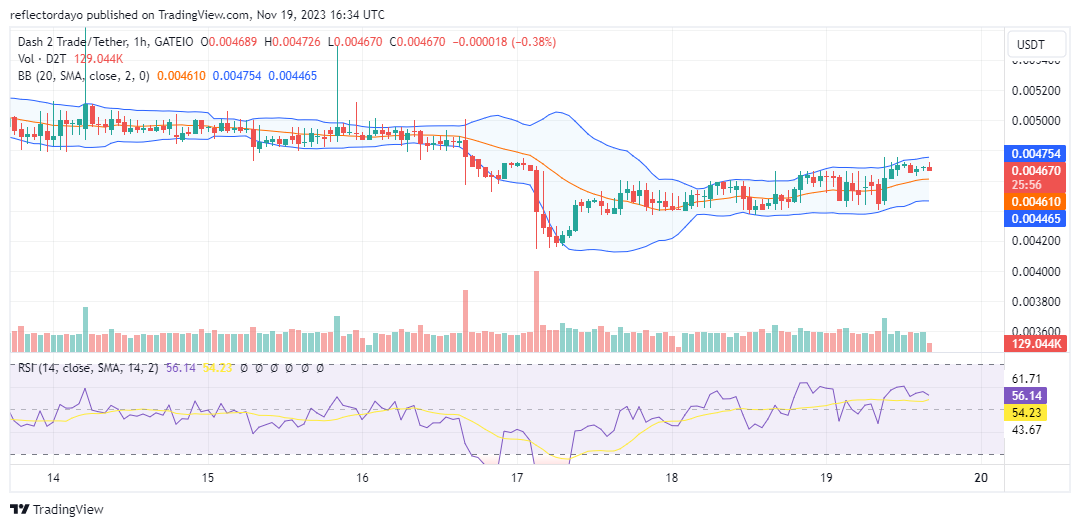
In the shorter time frame, the Bollinger Bands indicator is currently indicating an upward-moving price channel, suggesting a stronger bullish bias compared to the bearish bias. Nevertheless, the initial two candlesticks on the chart indicate a gridlock in investor interest in the market. Traders should remain vigilant at this juncture, monitoring for a potential breakout above the upper standard deviation. A push against this level could contribute to strengthening the bullish sentiment in the market.
With Dash 2 Trade, you have access to the latest trends and developments in the crypto space.
[ETF DELAYED] Possible Ethereum ETF Delay: e of Designation of a Longer Period for Commission Action on a Proposed Rule Change to List and Trade Shares of the Hashdex Nasdaq Ethereum ETF under Nasdaq Rule 5711(i)
The party is starting?
— Dash 2 Trade (@dash2_trade) November 17, 2023
Dash 2 Trade (D2T) is the coin. Buy D2T now!


Leave a Reply