Tamadoge Price Prediction – September 19
There has been a re-occurrence of trade situations denoting that the Tamadoge market’s price sets on a base located around the line of $0.009000, deeming spikes imputed.
The gradual movement of the formation pattern indicates that bulls are about to push most of the time against the trade value of the American coin from the point mentioned, and even if the price tends to decline, it will still result in a rejuvenation movement over the long, medium, or short term. Because of these psychological suppositions, buyers should keep thinking about hanging onto their positions.
TAMA/USD Market
Key Levels
Resistance levels: $0.01000, $0.01100, $0.01200
Support levels: $0.008500, $0.07500, $0.06500
TAMA/USD Medium-term Chart
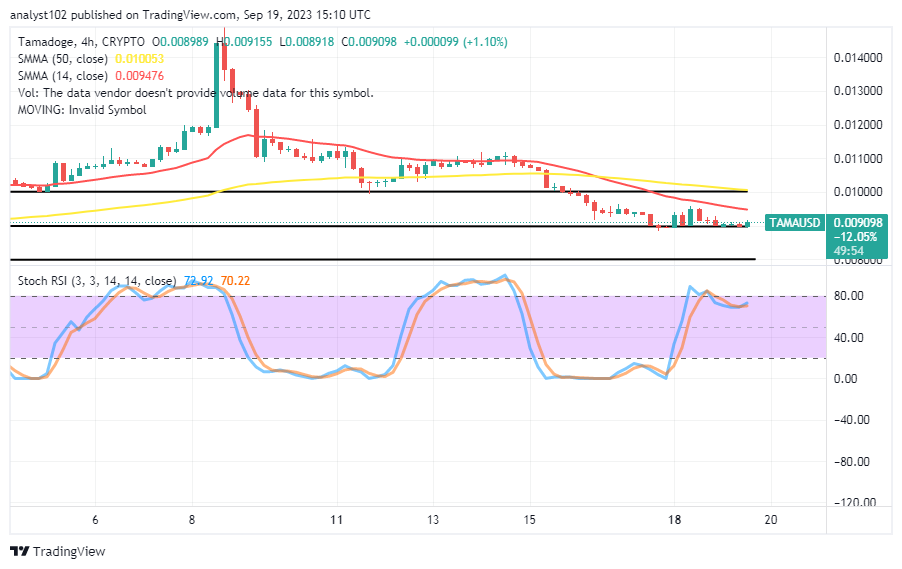
The TAMA/USD medium-term chart reveals that the crypto’s price sets on a base, deeming spikes traces.
The 14-day SMA indicator trends at the $0.009476 value line beneath the $0.010053 point of the 50-day SMA indicator. There has been a positioning format showcasing that stochastic oscillators have relatively slanted their presence southward before currently striving to diverge northbound to stay between 70.22 and 72.92.
Has there been a trade posture in the TAMA/USD market operations that suggests the price will soon overcome resistances?
Reading through the psychological positions of the indicators in the medium-term running mode, it appears that velocity to push farther has been reducing slowly in the TAMA/USD trade as the crypto-economic price sets on a base, deeming spikes from around the support line of $0.009000.
Even though the current negotiation process has shown promise of favorable trades, it is likely that they will find it difficult to sustainably breach above the moving averages’ values. Contrary to logic, those that take long positions should never stop doing so from this moment forward, when the price is trading at $0.009098 with a positive average percentage rate of 1.10.
TAMA/USD Short-term chart
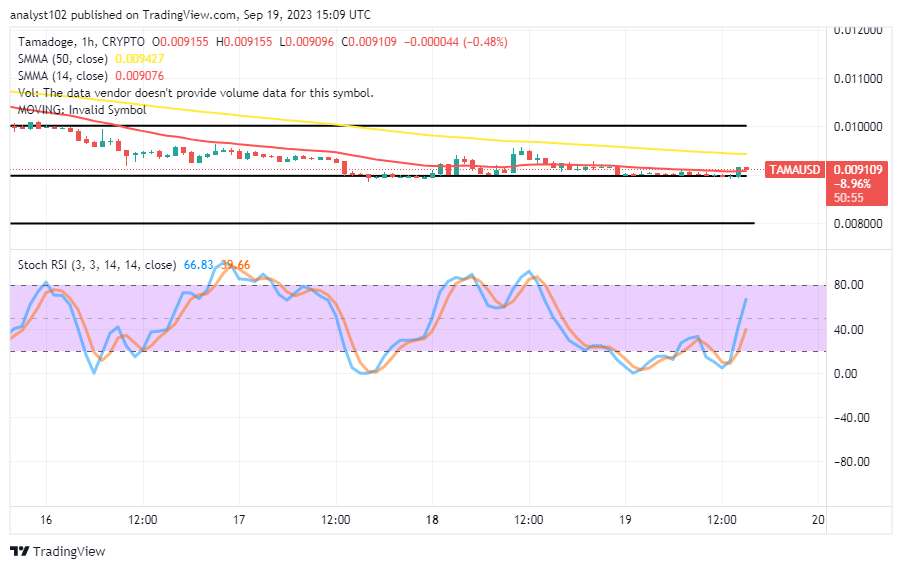
The TAMA/USD short-term chart depicts the crypto-economic price sets on a base of around $0.009000, deeming with spikes index.
The price has been encapsulated within clearly defined range-bound points of $0.00800 and $0.01000, allowing the 14-day SMA indicator to position below the 50-day SMA indicator, according to a closing mental trade point of view. And they are there, too. The stochastic oscillators, which are currently situated between 39.66 and 66.83, have previously reached certain regions in the oversold range. In the long term, buying patterns will still rule, no matter what.
Both Tamadoge Arena and Tamadoge Arcade are burning 100% of the money from in-game purchases.
We’re burning 100% off the revenue from in-game purchases across both Tamadoge Arena and Tamadoge Arcade.
— TAMADOGE (@Tamadogecoin) September 19, 2023
Play the games, Earn $TAMA and add to the burn!
Try our latest game Tamadoge Arena here 👇
📱 Android: https://t.co/INCaGendE4
📱 iOS: https://t.co/Fj9tT5Oicu pic.twitter.com/OT5jMVeQYX
Do you want a coin that would 100X in the next few months? That is Tamadoge. Buy TAMA today
Note:Forexschoolonline.com is not a financial advisor. Do your research before investing your funds in any financial asset or presented product or event. We are not responsible for your investing results.


Leave a Reply