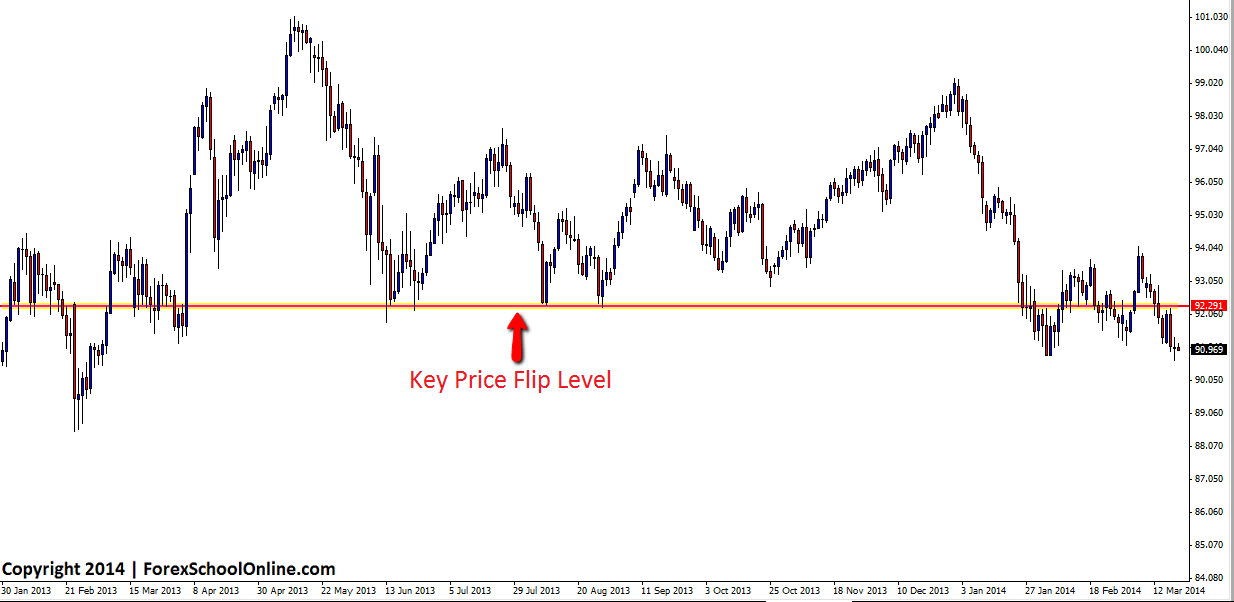
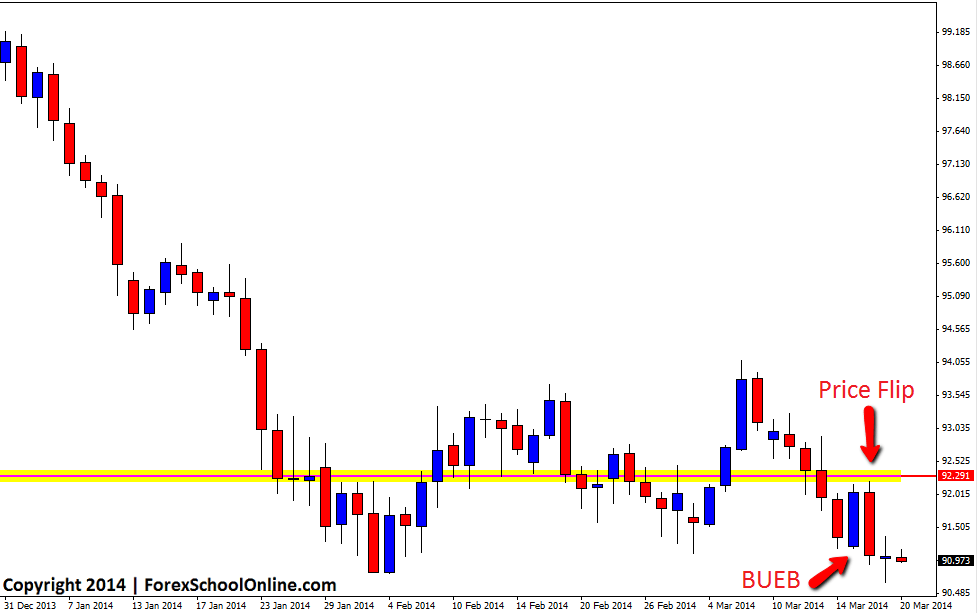
Price on the daily chart of the CADJPY formed a Bullish Engulfing Bar (BUEB) on the 17th March 2014. This BUEB was down at the low and rejecting the recent support area. The one important note to this Bullish Engulfing Bar was the area that it was trading into, known as a price flip area. I discuss in-depth what price flip areas are in the trading lesson here: Learning All About Price Action Price Flips
Basically; price flips are areas where price has flipped from support to resistance or vice versa. On the CADJPY chart, we can see that the level directly above the BUEB is a clear resistance level that has acted as major support area in the past. Now that price was under the old support area, there was a very high chance that this level would “flip” and look to hold as a new resistance point should price move higher to test it. Price did move higher and into the price flip area where price held as a new resistance confirming the price flip.
Why are these price flips so important? Because traders looking to take trades need to look out for them and make sure they are not entering trades straight into major price flips like this BUEB was entering into on the daily chart. The other reason is because price flips can be great areas to take high probability trades from. See the charts below:
CADJPY Zoomed Out

CADJPY Zoomed In


bookmarked!!, I lke your web site!
Hi Johnathon,
thanks for the great article.
imho, we need to sell from swing high (in downtrend) and buy from swing low (uptrend)
Yep exactly, unless continuation trading.
Hey Jonathan thanks for your insight! Always great stuff. One Question. How do we know not to take the first BEEB but wait for the second? http://screencast.com/t/OycAbMe8M5k
Hey Jonathan thanks for your insight! Always great stuff. One Question. How do we know not to take the first BEEB but wait for the second? http://screencast.com/t/OycAbMe8M5k
Hey Nick,
I replied to your questions on facebook yesterday. I had not seen it had come through here as they come through on facebook and on here. So I will copy & paste what I said there to here for you;
Hello Nick Osborn, Good question and good chart. We would not enter the first BUEB because it is trading straight into the overhead resistance price flip as explained in todays post. We would then also not trade the second BEEB (regardless of how it turns out) because it is a bearish reversal signal formed at a swing low. This is further explained in these two quick lessons here: https://www.forexschoolonline.com//how-professionals-trade…/ and https://www.forexschoolonline.com//make-money-trading…/