Tamadoge Price Prediction – August 23
A rallying motion has been staged between the transaction lines involving the business operations of Tamadoge’s pairing with the US currency, given that the crypto-economic trade springs up, averaging the resistance point of $0.00900.
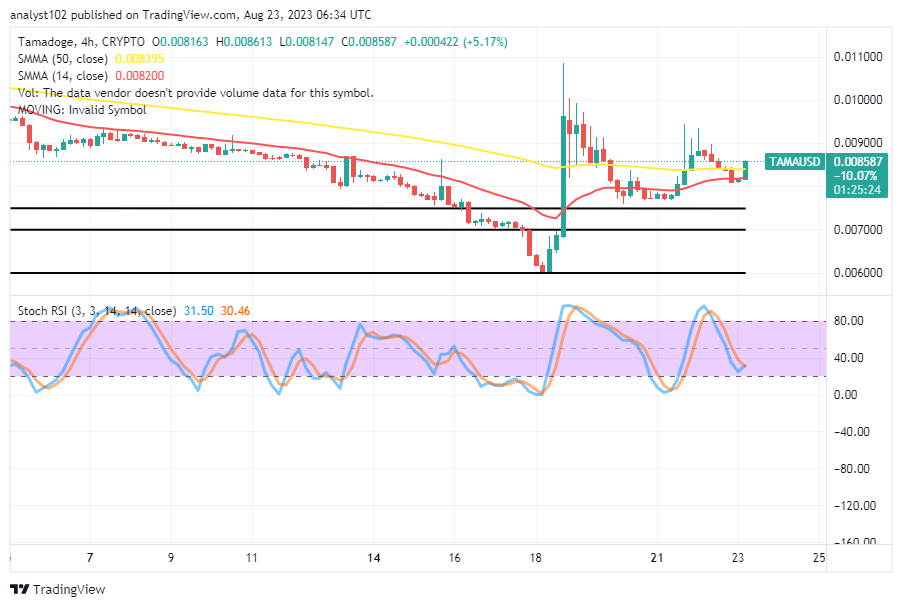
The price is currently trading around $0.008587, maintaining a positive percentage rate of 5.17 from the base point, where the current beefing higher has achieved a point close to above the support of $0.007500. All aspirations are growing to gradually develop ways back to the positive. Even if there is a sign to risk a shorting force at a certain period, traders should acquire more than they sell.
TAMA/USD Market
Key Levels
Resistance levels: $0.009500, $0.010000, $0.0105000
Support levels: $0.007500, $0.006500, $0.005500
TAMA/USD Medium-term Chart
The TAMA/USD medium-term chart reveals that the crypto-economic trade springs up from the logical support level of around $0.007500 and is averaging the value line of $0.00900.
The 14-day SMA indicator is gently moving upward, holding a point of $0.008200 under the 50-day SMA indicator’s value line of $0.008395. The stochastic oscillators are now positioned between 30.46 and 31.50 points after crossing northward from just below 20.
A bullish candlestick has formed above the TAMA/USD market’s price line at $0.008000; will it reverse direction to become nullified?
As there has been an emergence of a bullish candlestick in the Tamadoge market operation versus the US coin, the situation currently has it that the crypto trade springs up in a continuation of rises, given that the price is averaging the resistance spot of $0.009000.
Following the sustainable support identified at the support baseline of $0.006000 a few days ago, buying orders must continue as they are right now. The oscillators are used to identify an early signal, particularly one that will benefit takers of long positions, while pressures on the north side have been increasing. 
TAMA/USD Short-term chart
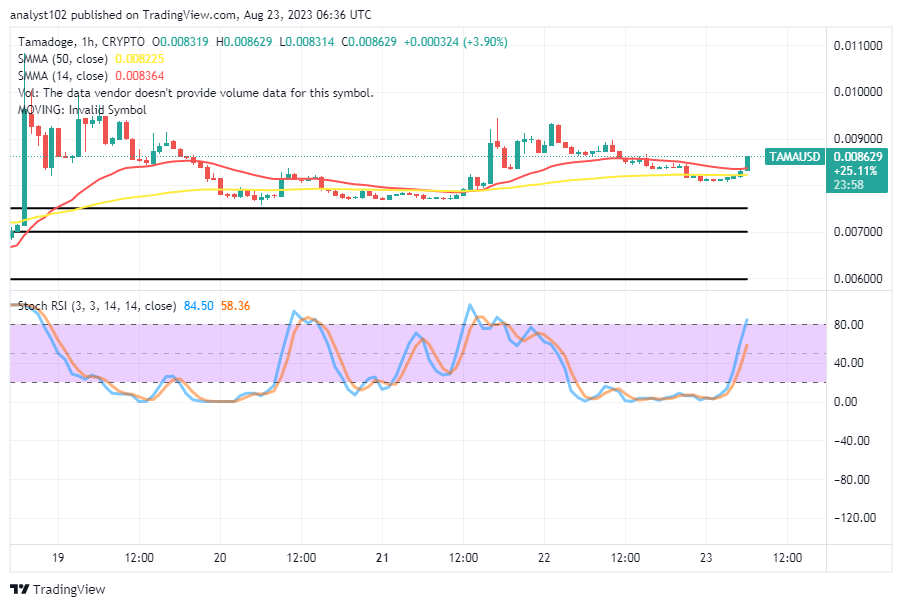
The TAMA/USD short-term chart reveals that the crypto trade springs up against the bargaining worth of the US currency, averaging the $0.009000 resistance line above the moving averages’ lines.
The $0.008364 level of the 14-day SMA indicator is just slightly higher than the $0.008225 level of the 50-day SMA indicator. The stochastic oscillators have finally moved northward to a position between 58.36 and 84.50, indicating that a line of topside velocities is still in motion. A rejection near a higher overhead resistance line may occur soon, sending the price back to additional rounds of decreases.
Which Tamadoge Arena improvement do you prefer to use to defeat those insane animals?
What’s your favourite Tamadoge Arena upgrade to take down those crazy critters? 🦔🐄
— TAMADOGE (@Tamadogecoin) August 22, 2023
Do you want a coin that would 100X in the next few months? That is Tamadoge. Buy TAMA today
Note: Forexschoolonline.com is not a financial advisor. Do your research before investing your funds in any financial asset or presented product or event. We are not responsible for your investing results.


Leave a Reply