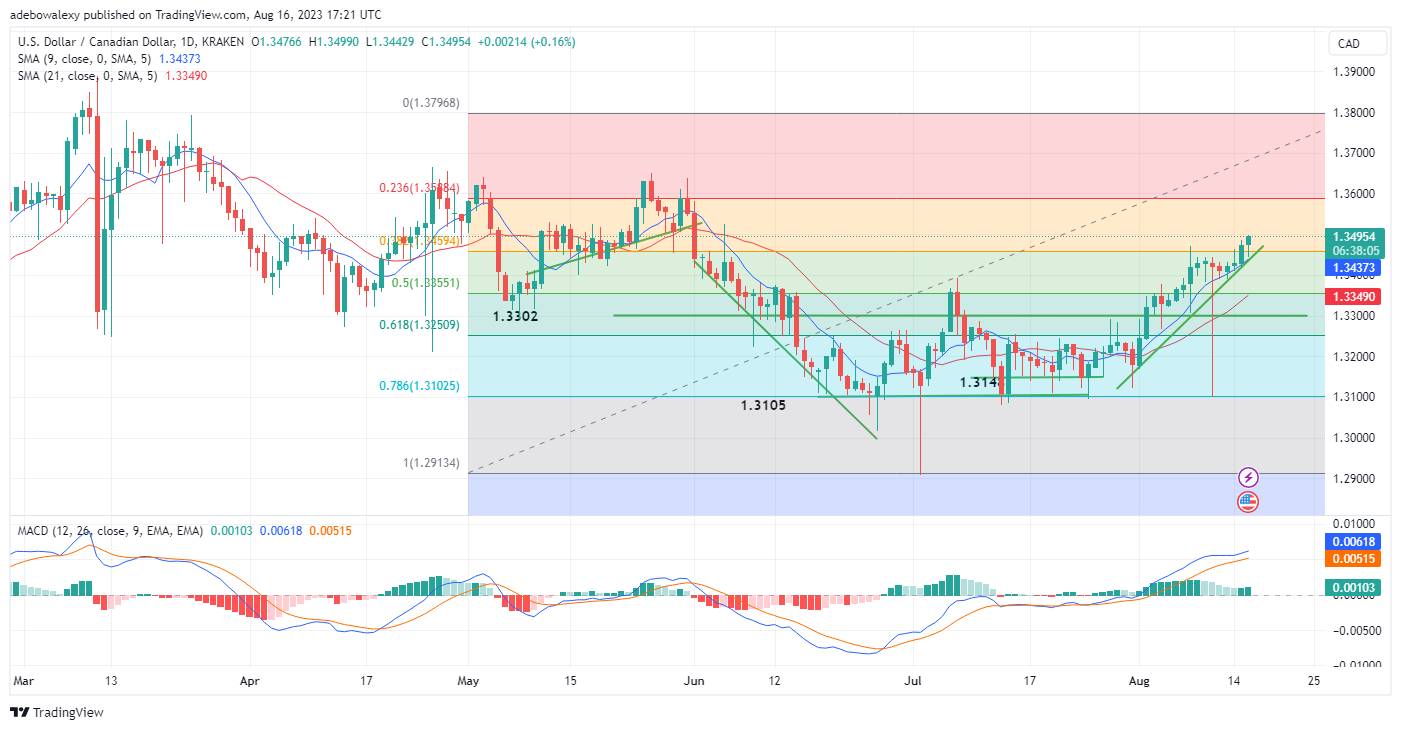
It appears that the USDCAD bulls have been stimulated by the inflation report that arrived today from the dollar region. Earlier today, price action behaved as if it were facing strong resistance, as it sits at a key support level near the 1.3450 mark. Let’s see how far the price can go from here.
Major Price Levels:
Resistance Levels: 1.3495, 1.3550, and 1.3600
Support Levels: 1.3455, 1.3400, and 1.3350

USDCAD Lifts Off the 38.20 Fibonacci Retracement Level
As earlier stated, price action in the USDCAD daily market had sat at the 1.3459 price level. Nevertheless, the upside traction continues to grow stronger and has lifted the pair’s price movements off the mentioned support. As a result, this has kept price action above the 9- and 21-Moving Average (SMA) curves. Also, the Moving Average Convergence Divergence (MACD) has revealed that the upside momentum continues to strengthen. This could be perceived as its last two histogram bars are now solid green, while the lines of the indicator have continued to rise further upwards.

USDCAD Stays Consistent with Upside Promises
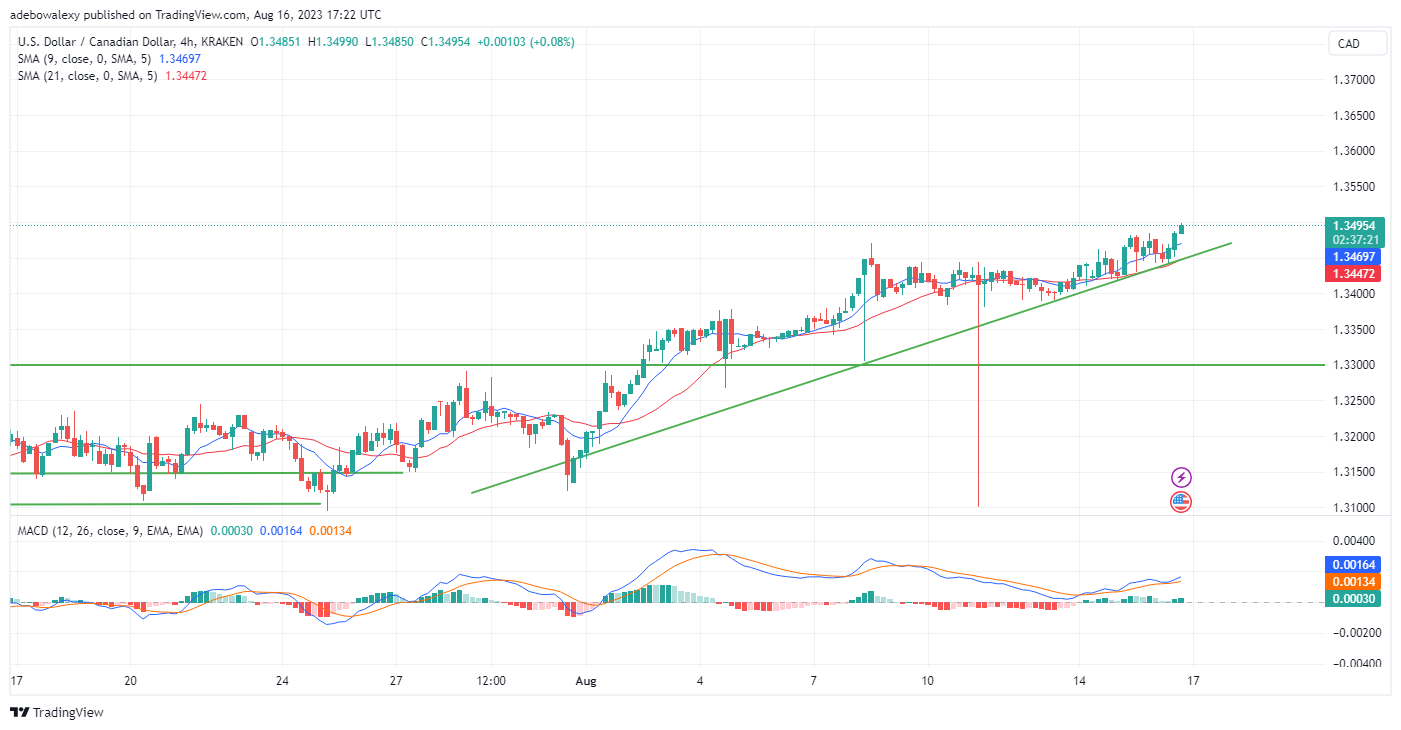
Likewise, the 4-hour market has revealed that the upside potential in the USDCAD market is undiminished. Here, the last three price candles have shown that buyers are progressively gaining. Additionally, the last price candlestick has risen above both the 9-day and 21-day SMA curves. Another indicator strengthening bullish hopes in this market is the MACD. Just like what was noticed on the daily market, the lines of this indicator have continued to rise upwards above the equilibrium level, with green bars appearing on it. At this point, prices seem to be eyeing the 1.3550 price level.
Do you want to take your trading to the next level? Join the best platform for that here.


Leave a Reply