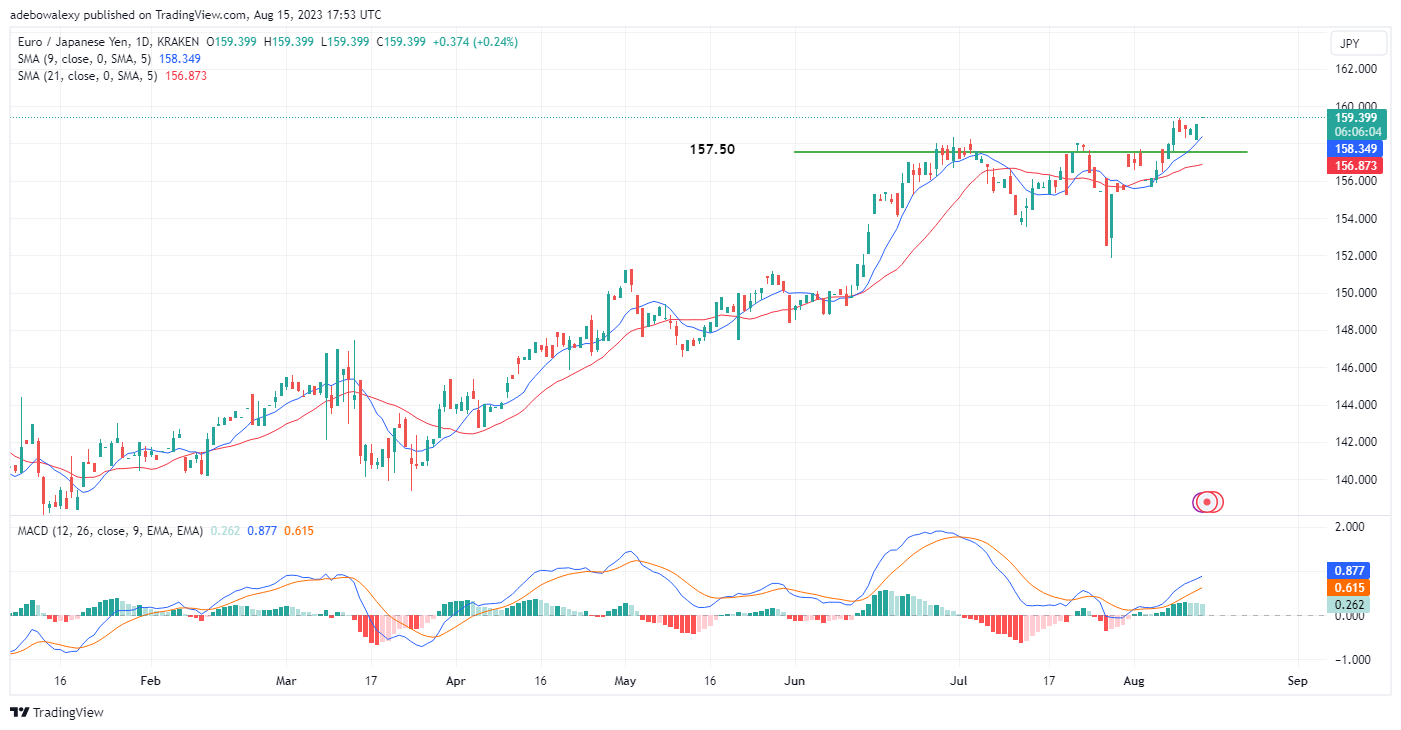
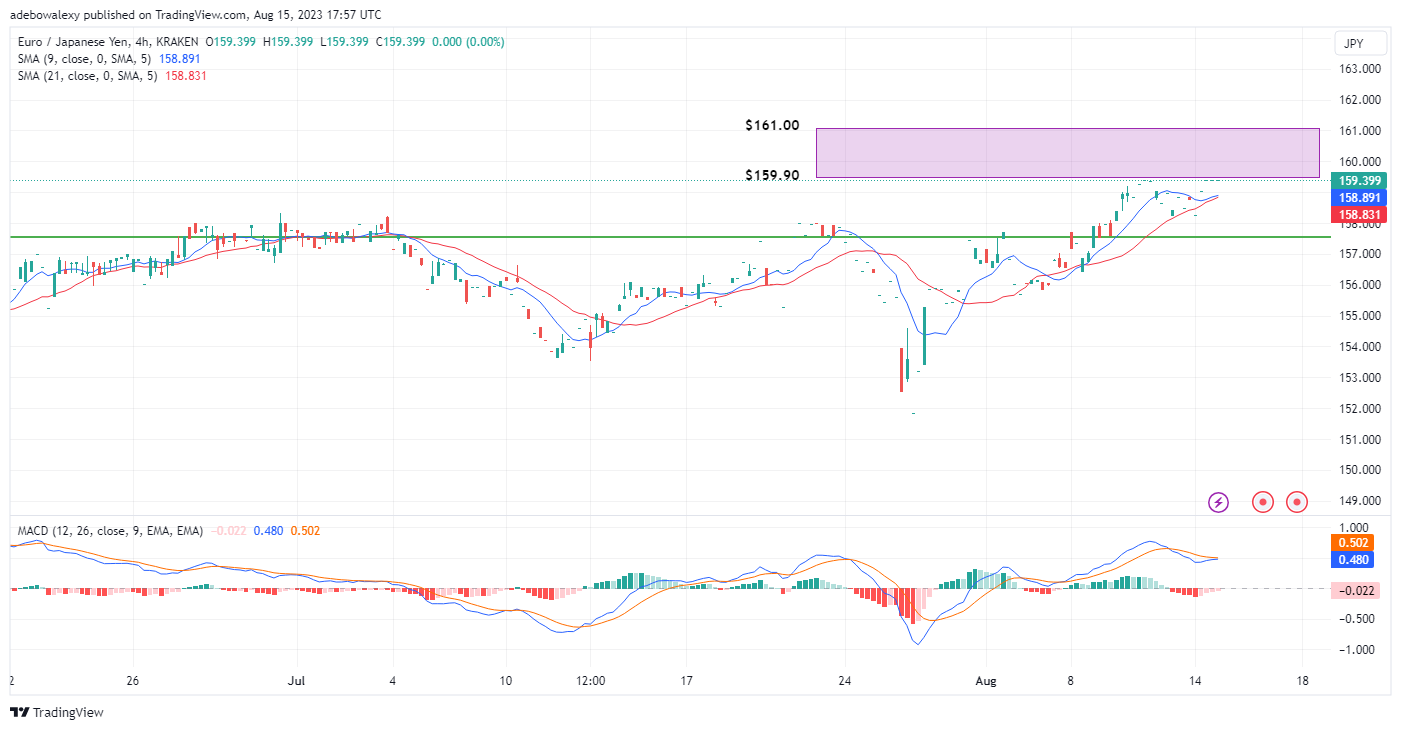
Since August 5, when price action ascended through the 156.00 price mark, prices have continued generally in the upside direction. However, there was a stop along the way, but the bulls were strong enough to come to the rescue, restoring the price action to its upside path. How far can bulls take us?
Major Price Levels:
Resistance Levels: 159.39, 160.50, and 161.50
Support Levels: 159.00, 158.00, and 157.00

EURJPY Continues to March Northwards
Over the past two trading sessions, EURJPY price action has maintained its upside path after rebounding off the 9-day Simple Moving Average lines. The ongoing session shows that upside forces have overpowered downward ones as a dashed-shaped price candle has further raised the pairs price closer to the 160.00 threshold.
Nevertheless, there are signs of weakness in the price upside move, as indicated by the bars of the Moving Average Convergence Divergence (MACD) indicator bars. These bars can be seen appearing pale green above the equilibrium level. But, despite this, price action has continued to the upside.

EURJPY May Trade Above the 180.00 Mark
Price action in the EURJPY market seems to be eying trading above the 160.00 mark shortly. This inference is drawn from the fact that the 9- and 21-day SMA curves seem to be attempting a crossover below the current price level.
Likewise, the MACD lines are also converging for a bullish crossover above the equilibrium level. Consequently, this agrees with the opinion that more upside momentum is to be delivered to price movement. As a result, this may send price action higher above the 160.00 mark, raising it towards the 161.00 price level in a short while.
Do you want to take your trading to the next level? Join the best platform for that here.


Leave a Reply