Tamadoge Price Prediction – July 31
There have been variant progressive movement stands as regards the Tamadoge market operations against the US Dollar, given that the crypto-economic trade keeps above $0.0100, beefing catalysts ahead of presumable northward breaking exercises.
Even if the psychological support level of $0.0100 is ultimately broken, it will indicate that investors have opened up a fresh window for seeking chances at a more uncommonly low valuation. Never, under any circumstances, should intending long-position placers hump into a volatile motion that might quickly achieve its peak. Based on that technical trade hypothesis, it would be ideal for investment binges and buying orders to continue at this moment, despite bulls’ efforts over time to push prices below the levels between $0.01200 and $0.01100.
TAMA/USD Market
Key Levels
Resistance levels: $0.01100, $0.01150, $0.01200
Support levels: $0.00950, $0.00900, $0.00850
TAMA/USD Medium-term Chart
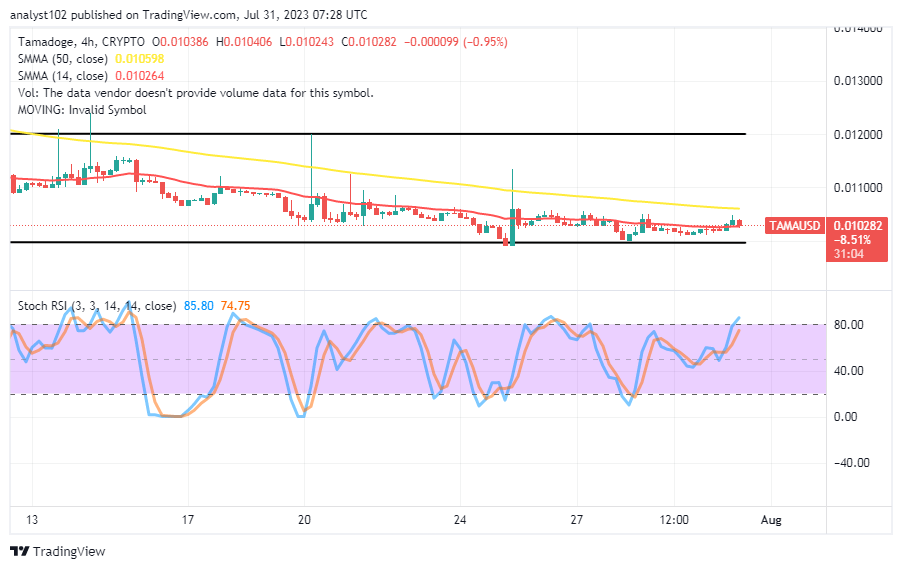
The TAMA/USD medium-term chart reveals that the crypto-economic trade keeps above $0.01000, beefing up catalysts in attempts to breach northward through resistances.
The 14-day SMA indicator is at $0.010264, beneath the $0.010598 value of the 50-day SMA indicator. The Stochastic Oscillators have lackadaisically swerved northbound to position between 74.75 and 85.80 points, denoting that forces on the path to the furtherance of movements are liable to encounter hard barrier lines.
At this time, how tactically should the TAMA/USD bears position themselves near the SMA trend lines?
The Tamadoge market activity has witnessed some moments of reversal patterns, following some moments of false breakups in recent times, to showcase against the trend line of the 50-day Moving Average, given back in return that the crypto-economic trade keeps above the $0.01000, beefing catalysts.
A quick technical examination of this crypto economy’s future from a longer time horizon reveals that the velocity weight still seems to delay the anticipated recovering motions, allowing investors to continue using their strategy of buying the dips. The ultimate end of the dipping session cannot be determined, though, because a huge explosion is likely to take place when the time is right. 
TAMA/USD Short-term chart
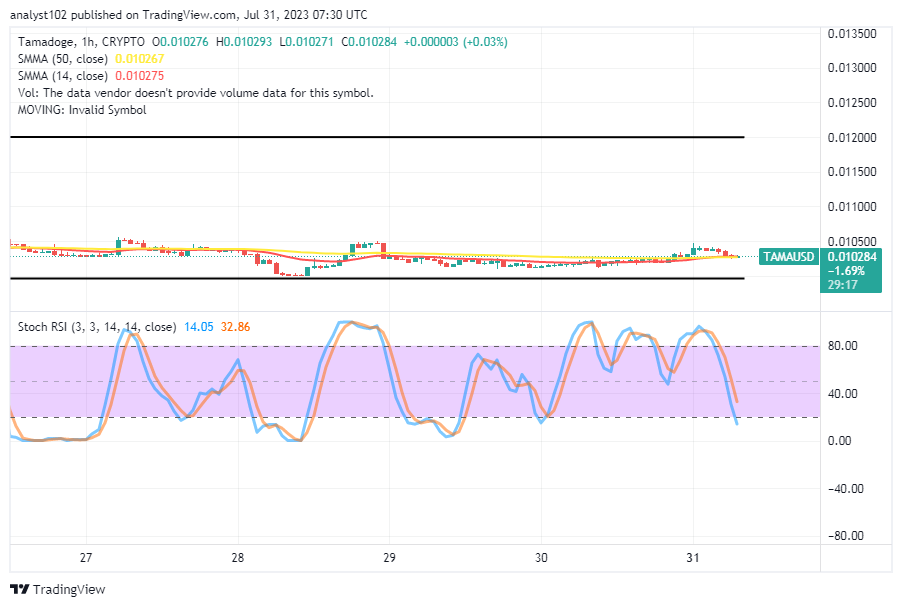
The TAMA/USD short-term chart showcases the crypto market keeping above the $0.01000 support trade line, tempting catalysts.
The 50-day SMA indicator and the trend line for the 14-day SMA have been set up to move steadily eastward. The stochastic oscillators are now located between 32.86 and 14.05 points after crossing southward from the overbought area. The current level is still one of the better longing moments, according to our trade judgment.
Another glimpse of our brand-new 3D Tamadoge Arena is provided here.
👀SNEAK PEAK👀
— TAMADOGE (@Tamadogecoin) July 28, 2023
Here’s another preview of our all-new 3D Tamadoge Arena 😍#web3gaming #3dgameart pic.twitter.com/ykNzihs8k3
Do you want a coin that would 100X in the next few months? That is Tamadoge. Buy TAMA today
Note: Forexschoolonline.com is not a financial advisor. Do your research before investing your funds in any financial asset or presented product or event. We are not responsible for your investing results.


Leave a Reply