Tamadoge Price Prediction – July 18
An elongation of variant trading moments being enjoyed by the leftover falling forces against the market valuation of Tamadige has made the crypto-economic price to dwindle continually, trying to set a basis for a while.
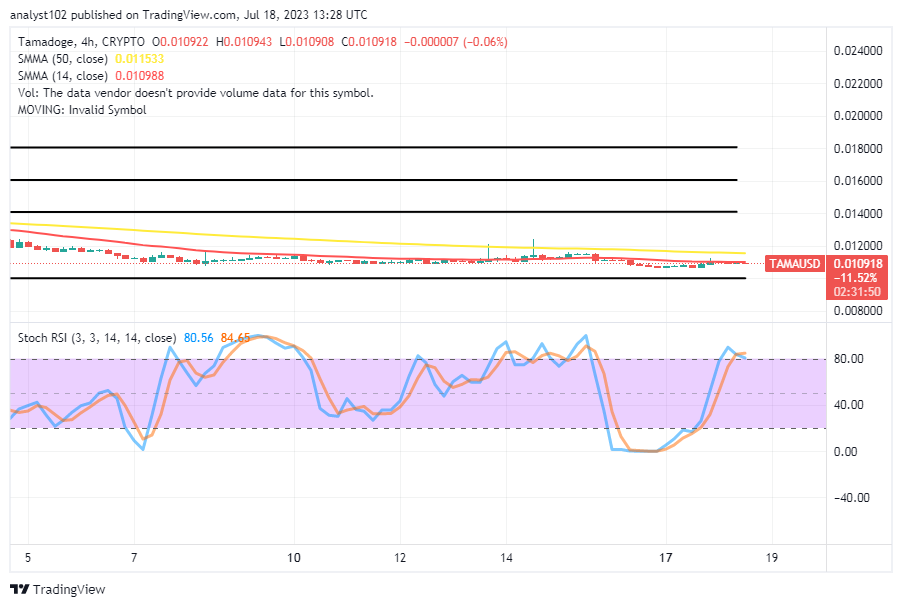
No matter how long the dwindling trade progresses, a rebound will surely come as long as investors are willing to buy on the dips until the time ripens to nullify any other forms of decreasing patterns. As it is showcased on the medium-term run, buyers’ reactions have been red-flagged to be between the values of $0.010943 and $0.01908 at a minute negative percentage rate of 0.06.
TAMA/USD Market
Key Levels
Resistance levels: $0.01200, $0.01400, $0.01600
Support levels: $0.01000, $0.00900, $0.00800
TAMA/USD – 4-hour Chart
The TAMA/USD 4-hour chart showcases that the crypto-economic price continues to dwindle, trying to set a basis within the range-bound spots of $0.01200 and $0.01000.
Variant smaller sizes of candlesticks representing ups and downs have been around the trend line of the smaller SMA to signify that buyers are yet to move the levels higher away from it. The 50-day SMA trend line is closely above the 14-day SMA trend line. The Stochastic Oscillators have traversed northbound into the overbought region to position themselves from 84.65 to 80.56 levels. The buying force is getting set to shift against northward pushes.
How is the trading environment right now on the TAMA/USD market?
There have been signs to denote that there will be a prolongation of smaller ups and downs in the TAMA/USD market business, as it has been noticed that the crypto-economic price has continued to dwindle within the range-bound spots of $0.01200 and $0.01000 over time, trying to set a basis.
The potential trade direction in the TAMA/USD business has not appeared ready to leave above the resistance line of $0.01200 in order to let intending investors join the crypto economy at its best lower-trading value. The present reading index on the Stochastic Oscillators affirms that buyers have to maintain patience to the core. Their positions are to run long-term afterward. 
TAMA/USD 1-hour chart
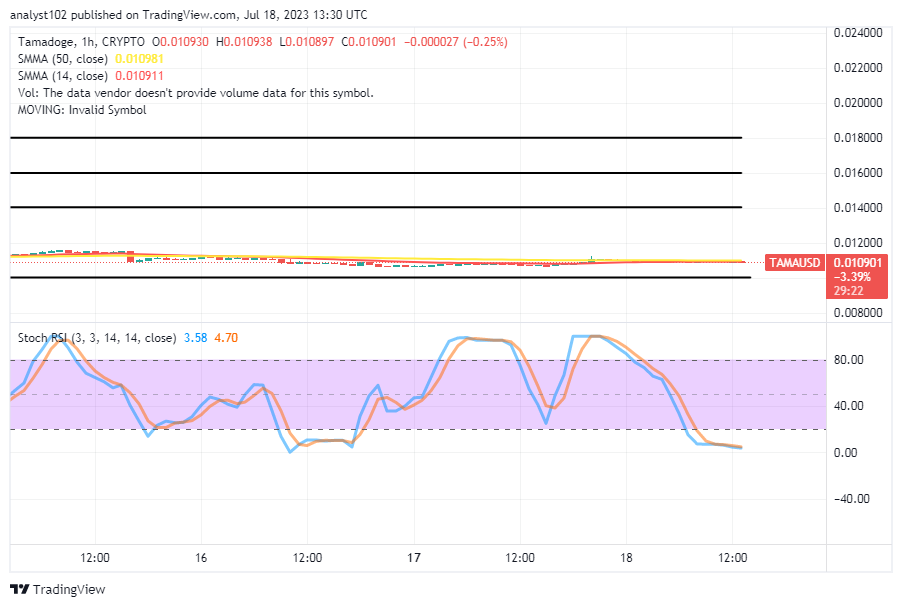
The TAMA/USD 1-hour chart showcases the crypto price continuing to dwindle, trying to set a base around the conjoined trending arena of the SMAs.
The 50-day SMA trend line has tightly moved alongside the 14-day SMA trend line. The Stochastic Oscillators have positioned themselves in the oversold region to move in a consolidation manner. The horizontal line is drawn around the lower range point of $0.01000. On a higher time frame of daily trading, it has shown that investors will not have to worry about quitting the market at lower points.
Here it is for the entire world after we shared our first piece of concept art for the Pet Store NFT collection with our Tamadoge Telegram community. Share your opinions in the thread.
💥NEW WORK ALERT💥
— TAMADOGE (@Tamadogecoin) July 18, 2023
We released our first concept art for the Pet Store NFT collection to our Tamadoge Telegram community, and here it is for the whole world! 🤩 Let us know your thoughts in the thread 🧵#NFT #Web3Gaming pic.twitter.com/nMRNiIbtkD
Do you want a coin that would 100X in the next few months? That is Tamadoge. Buy TAMA today
Note: Forexschoolonline.com is not a financial advisor. Do your research before investing your funds in any financial asset or presented product or event. We are not responsible for your investing results.


Leave a Reply