Tamadoge Price Prediction – July 16
There has been a continual progression of the inability of bulls to hold sustainable rising positions in the Tamadoge market operations against the US Dollar as the crypto-economic prices lower, prolonging an explosion.
The falling pace in the market might be coming forth in a boring mode or causing a panic moment, as the long-awaited booming sessions have not been until now. As of this technical article, today’s operation shows the price at $0.74% to fluctuate between $0.010875 and $0.010736. It is suggested that purchasers who have numerous orders open add additional positions if they so choose. But at this juncture, new investors ought to move swiftly into the dips before the anticipated mooning cycles come to play out.
TAMA/USD Market
Key Levels
Resistance levels: $0.01200, $0.01400, $0.01600
Support levels: $0.01000, $0.00900, $0.00800
TAMA/USD – 4-hour Chart
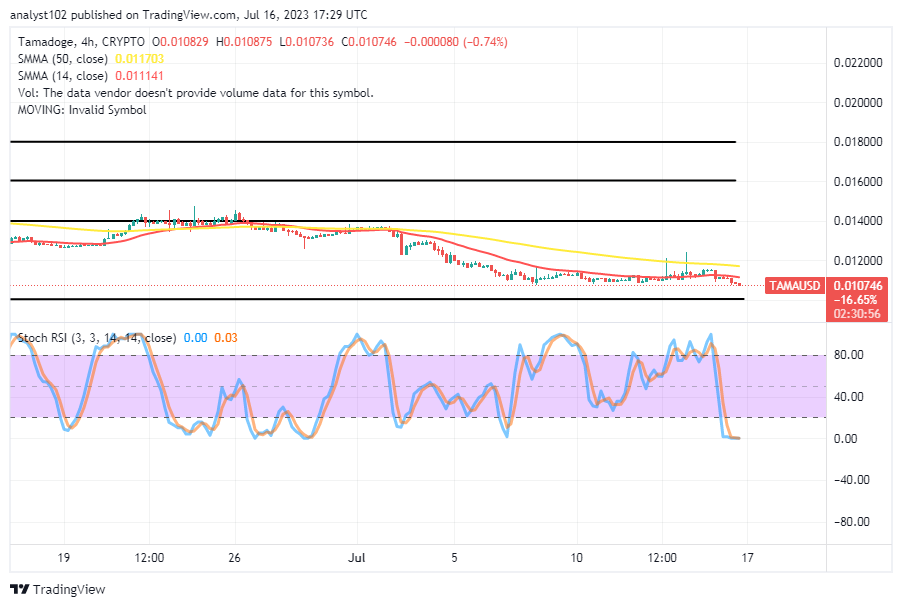
The TAMA/USD 4-hour chart showcases the crypto-economic prices lower, prolonging an explosion within the range-bound spots of $0.01000 and $0.01200.
The 14-day SMA indicator is at 11141, underneath the $0.011703 point of the 50-day SMA indicator. The selling candlesticks that have been featured have now indicated one of the lowest lows that, if bears attempt to further push, will be liable to encounter a rebound. The Stochastic Oscillators have dipped into the oversold region at the points of 0.00 and 0.03. It signifies that an increase is in the offing.
Will the current pushing force allow the TAMA/USD market sellers to push as low as $0.01000?
The southward shifting proceedings have been relatively ongoing owing to the failure of bulls to move forcibly against the correctional forces that have predominated the pace in the TAMA/USD market operation as the crypto-economic prices lower, prolonging an explosion.
Currently, most of the indicators on the medium- and short-term outlook are complementing the position of the long-term’s oscillators, indicating that oversold conditions have been reached to a logical point that is most rarely found. Based on that angle, it would be okay for buyers to buy at this dip. By the time a bounce-up occurs, opened long-position orders will recoup in the form of sequential orders afterward.
TAMA/USD 1-hour chart
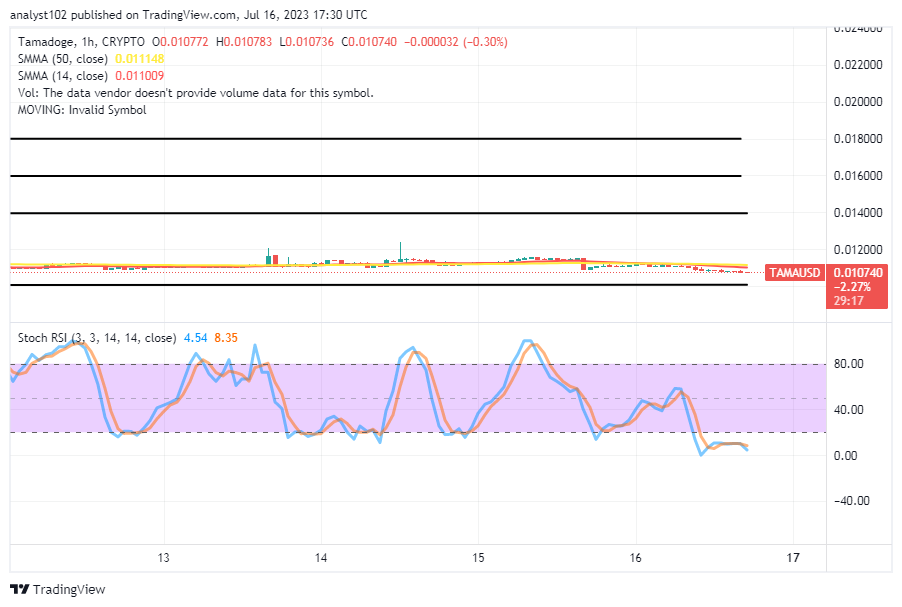
The TAMA/USD 1-hour chart reveals the crypto-economic prices are lower, prolonging an explosion within the range-bound zones of $0.01000 and $0.01200.
The reaction of the price so far has been negative around the conjoining areas of the 14-day SMA and the 50-day SMA. The Stochastic Oscillators have been moving in the oversold region between 8.75 and 4.54. As it stands, it is advised that new traders and investors take large positions before the indicators change the signals that they are currently sending. This portends that a minor move to the decrease side is somewhat sensed.
Weekly Tamadoge Update: Chris and Tom’s marketing-focused segment
— TAMADOGE (@Tamadogecoin) July 14, 2023
Twitter (https://twitter.com/Tamadogecoin/status/1679841120140836864?ref_src=twsrc%5Etfw) TAMADOGE https://t.co/nHawoRt71n
Do you want a coin that would 100X in the next few months? That is Tamadoge. Buy TAMA today
Note: Forexschoolonline.com is not a financial advisor. Do your research before investing your funds in any financial asset or presented product or event. We are not responsible for your investing results.


Leave a Reply