Tamadoge Price Prediction – June 30
From the technical point of view, the TAMA/USD price may prolong range moves, nursing a bounce on a consistent motion psyche.
Many of the market’s transaction operations have been staged to be between the trade values of $0.013708 and $0.013334, keeping a minute negative percentage rate of 0.23. No matter what the situation between the spots of $0.01400 and $0.01200, buyers will most likely make out their ways against declines in no time.
TAMA/USD Market
Key Levels
Resistance levels: $0.01500, $0.01600, $0.01700
Support levels: $0.01200, $0.01100, $0.01000
TAMA/USD – 4-hour Chart
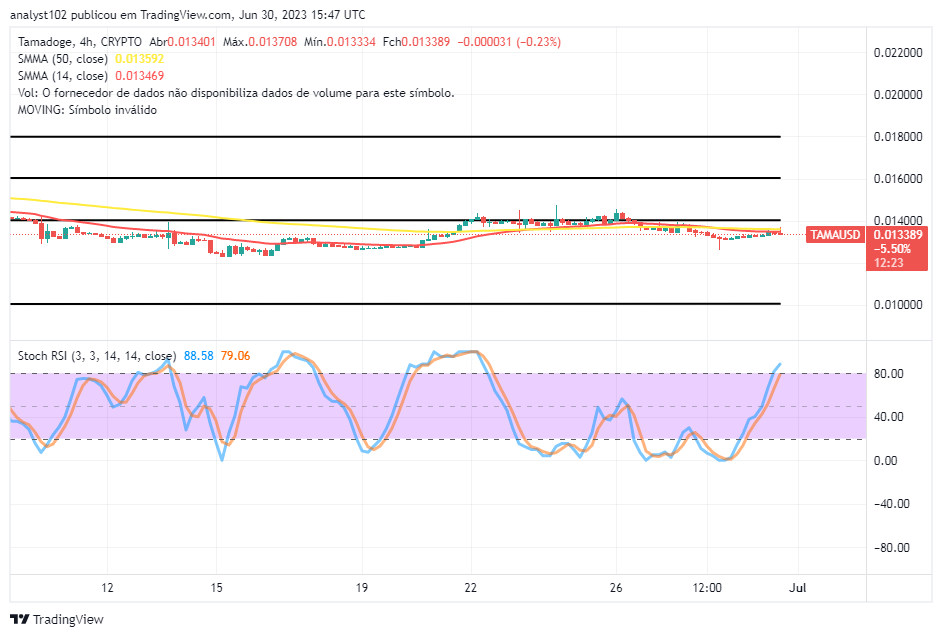
The TAMA/USD 4-hour chart showcases that the crypto price may prolong range moves, nursing a bounce from underneath the trend lines of the SMAs at a closure point.
At the moment of this technical piece, the 14-day SMA indicator is at $0.013469, one point below the $0.013592 value of the 50-day SMA indicator. The Stochastic Oscillators have sprung northbound from the oversold region to keep positions between 79.06 and 88.58 points to indicate that an overbought condition is being relatively reached.
How should traders respond to the SMA indicators in the TAMA/USD market operations presently?
The formation of candlesticks representing the actual state of trade activities has been featured around the values of the SMAs that appear to be more conjoined, as it has been suggested that the TAMA/USD price may prolong range moves, nursing a bounce output.
It must be noted from a psychological point of view that only the Stochastic Oscillators and other economic trade tools like RRS and others in their categories can help to determine the true position that the market maintains, as there has been a concurrent appearance of sideways movement. That is, considering the current trade value of the current price valuation, bulls are still expected to keep healthier at the slightest weakness of bears.
TAMA/USD 1-hour chart
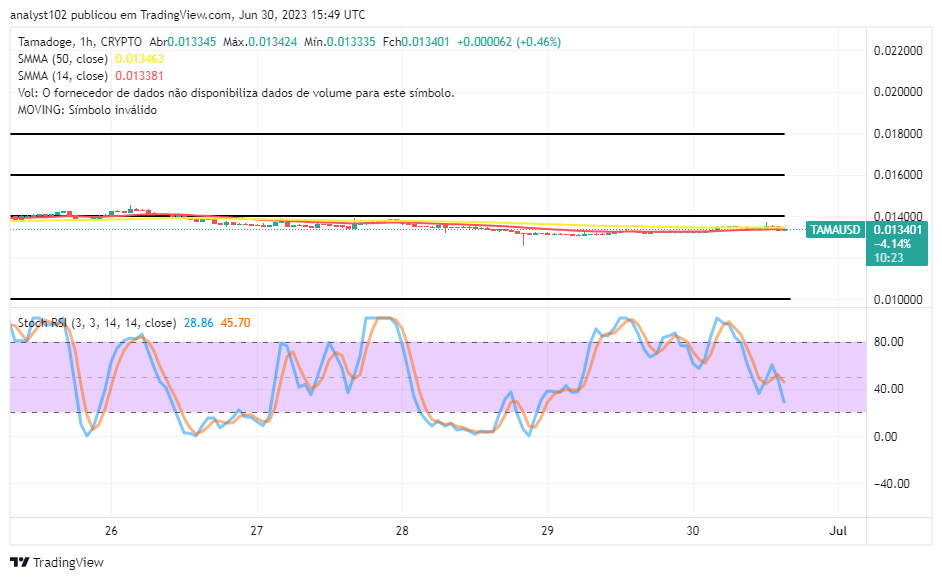
The 1-hour chart showcases that the crypto’s price is prolonging range moves, nursing a bounce status around the trend lines of the SMAs.
Like many other charts, this one’s formation pattern still demonstrates that a recurrence of price situations has been centered around the SMAs in a clearly defined range-bound value range. The 14-day and the 50-day SMAs are trending eastward, close to $0.01400 at the bottom. The Stochastic Oscillators have been positioned southbound to keep points between 45.70 and 28.86. That makes our verdict that buyers are getting set to take on a rebound after the ice touches a final lower point for exhaustion.
You may either get your paws on some bones and bury them in the yard.
You could hide your bones in the yard, or you could get your paws on some $TAMA 💰
— TAMADOGE (@Tamadogecoin) June 30, 2023
Buy the best memecoin with utility here 👉 https://t.co/KONwEq6eb4 pic.twitter.com/F9l7E8t4tH
Do you want a coin that would 100X in the next few months? That is Tamadoge. Buy TAMA today
Note: Forexschoolonline.com is not a financial advisor. Do your research before investing your funds in any financial asset or presented product or event. We are not responsible for your investing results.


Leave a Reply