Tamadoge Price Prediction – June 24
The TAMA/USD market confines itself to sideways motions, aiming for a bounce around the resistance of $0.01400 with less-active gravity.
A financial technical trade observing from a long-term run analytic basis suggests that long-position takers will need much time to garner energy as the price trades between tight transaction paces of $0.014090 and $0.013889 value lines at a minute percentage rate of 0.44 positive. The overriding trade recommendation presently is that buyers need to permit a drop leading to the creation of complementing affirmation among the tools at the lower zone to signify the probable push to the upside before going for longing orders.
TAMA/USD Market
Key Levels
Resistance levels: $0.01500, $0.01600, $0.01700
Support levels: $0.01200, $0.01100, $0.01000
TAMA/USD – 4-hour Chart
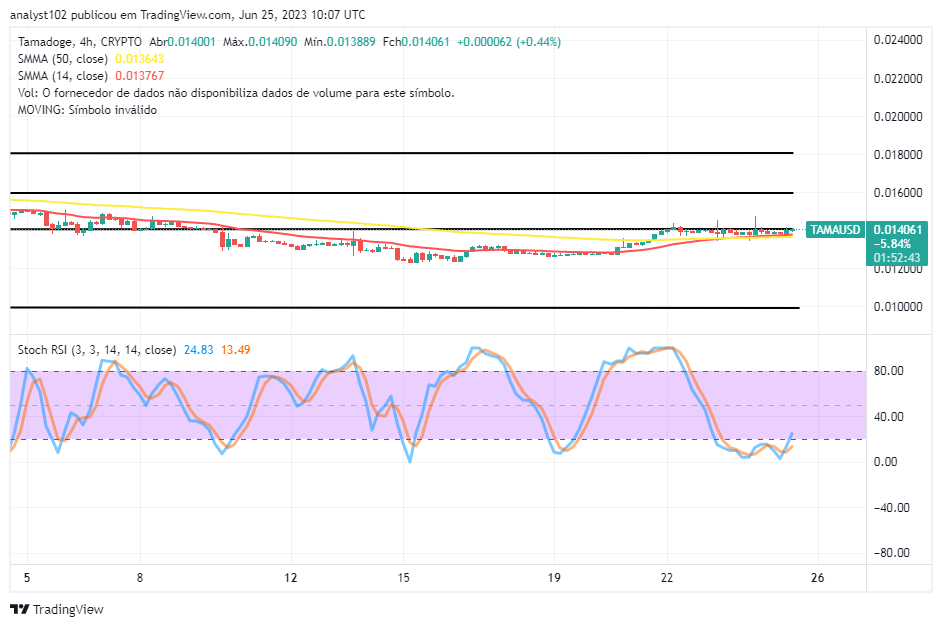
The TAMA/USD 4-hour chart reveals that the crypto-economic market confines itself to sideways, aiming for a bounce around the trending arenas of the indicators.
The positioning of the trading indicators reveals that the 14-day SMA trend line is at $0.013767 over the $0.013643 point of the 50-day SMA trend line. The Stochastic Oscillators are in the oversold region, making an attempt to swing northbound from 13.49 to 24.83 levels. From psychological perspectives, it appears that the moves to the north will not generate much shift in the medium-term run to generate more considerable levels of profits.
If the SMAs cross each other in the negative, would the TAMA/USD market experience any additional frightful pushes?
An emergence of a bearish candlestick leading to a cross of the bigger SMA by its smaller counterpart on the south side might signal the resumption of falls to reset for a base below the indicators as the TAMA/USD market confines itself to sideways, aiming for a bounce.
Trading activities involving buying deals have to be left to run on a long-term basis, not minding any moves downward away from the values of the SMAs.
T
AMA/USD 1-hour chart
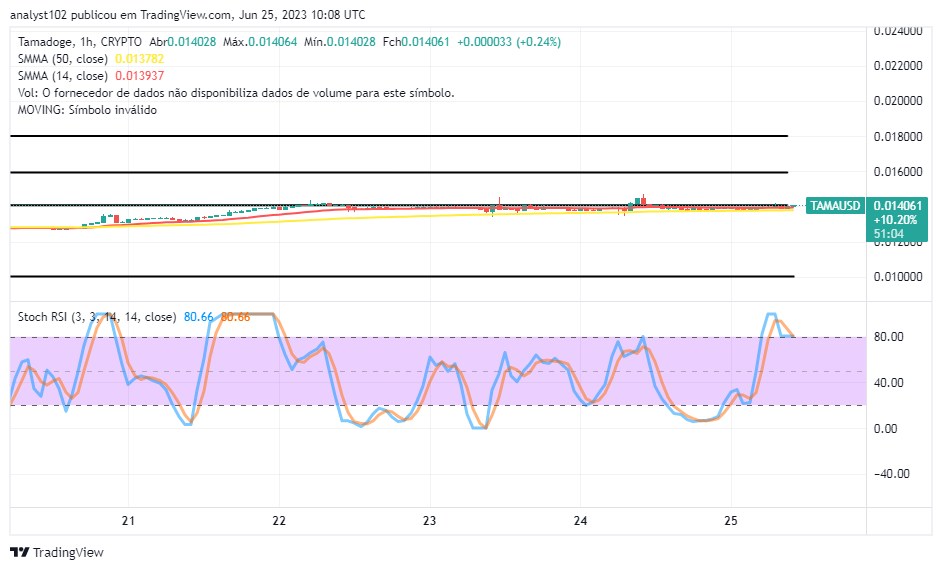
The 1-hour chart showcases that the price of the cryptocurrency market confines itself to sideways, aiming for a bounce around the resistance-trading spot of $0.01400.
The 14-day SMA trend line is $0.013937 above the $0.013782 value line of the 50-day SMA trend line. The Stochastic Oscillators have moved into the oversold region, seemingly trying to cross back southbound at the same level of 80.66. That could mean that an indecisive trading session might surface. However, bears seem to have an upper-range chance of holding positions against any rise in one way or another at this time of analysis.
Don’t tell us you’re playing the best play-to-earn game without actually telling us that you are….
Tell us you’re playing the best play-to-earn game without telling us you’re playing the best play-to-earn game… 👾💸 pic.twitter.com/YcAdaUtWwu
— TAMADOGE (@Tamadogecoin) June 23, 2023
Do you want a coin that would 100X in the next few months? That is Tamadoge. Buy TAMA today
Note: Forexschoolonline.com is not a financial advisor. Do your research before investing your funds in any financial asset or presented product or event. We are not responsible for your investing results.


Leave a Reply