Tamadoge Price Prediction – June 23
The TAMA/USD market is holding a correction, settling for a systemic hike around the resistance line of $0.01400.
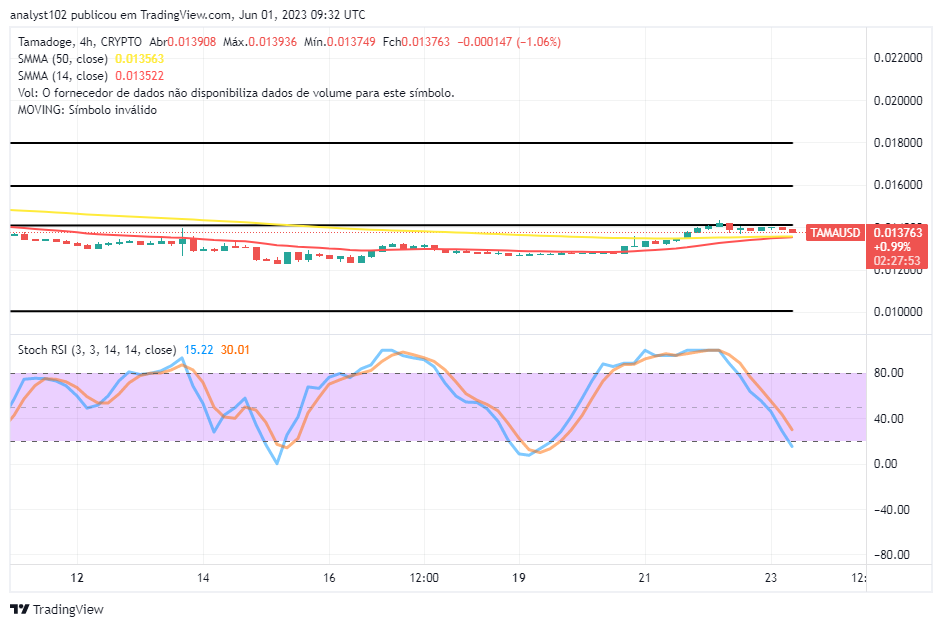
At this point in the technical component, buyers and sellers are staged at an average negative percentage rate of 1.06 between the maximum and minimal value lines of $0.013936 and $0.013749. Given that presumption, holders of long positions must adhere to the trading rule of care in order to prevent a strong re-buy pattern from taking shape before the support line of $0.01200.
TAMA/USD Market
Key Levels
Resistance levels: $0.01500, $0.01600, $0.01700
Support levels: $0.01200, $0.01100, $0.01000
TAMA/USD – 4-hour Chart
The TAMA/USD 4-hour chart reveals that the crypto-economic price is holding a correction, settling for a hike around the trend lines of the SMAs.
Presently, the trending arrangement pattern between the trading indicators depicts that the 14-day SMA is at $0.013522 below the $0.013563 value line of the 50-day SMA. The horizontal line drew at $0.01400, marking up the crucial barrier zone that bulls heeded to muscle up their efforts forcibly against in the current up-surging motion set up. The Stochastic Oscillators are in a southbound-crossing mood from the overbought region to 30.01 to 15.22 levels to denote that a decline is ongoing.
Will the current correctional movement in the TAMA/USD market pose much danger toward underlying supports around $0.01200?
Lots of buying back window opportunities will be derived even if there are aggressive declines in the trade of operations in the TAMA/USD market, given that the crypto-economic price is holding a correction, settling for a hike in the long-term run afterward.
Buyers will have to be reclaiming their stances between the vital lines of $0.01200 and $0.01400, back up to the critical point of $0.01400, and possibly in the extension of $0.01500. Taking a look at the daily chart’s reading posture of the Stochastic Oscillators, the condition showcases that the buying cycle will be settling for a respite around or below the horizontal line drawn closely over the SMAs before swinging back northward.
TAMA/USD 1-hour chart
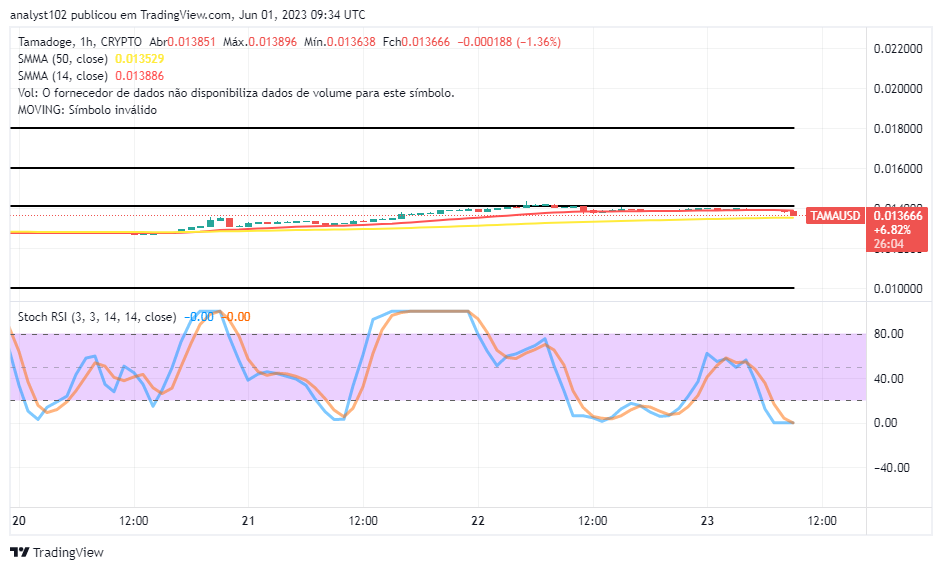
The price of the cryptocurrency market is holding a correction, settling for a hike around the trend line of the larger indicator, as seen by the TAMA/USD 1-hour chart.
The 14-day SMA trend line is $0.013886 above the $0.013529 point of the 50-day SMA trend line, according to the short-term reading compilation note of the indicators. To sustain zero levels, the stochastic oscillators have moved their base towards the oversold area. We advise existing buyers not to underleverage their equity, especially if it isn’t strong enough to resist any potential test that could cause the market to fall sharply before recovering in an extraordinary assumed recovery.
Failure to plan is planning to fail. Keep your credit pot in good shape to ensure that your name leads the leaderboards.
Failing to prepare is preparing to fail… Make sure your name dominates the leaderboards by keeping your credit pot healthy 💰
— TAMADOGE (@Tamadogecoin) June 23, 2023
You can top up your credits with $TAMA in the Tamadoge Arcade and keep the game going here 👉 https://t.co/0rVql9JrJT pic.twitter.com/8cEtxHdTSM
Do you want a coin that would 100X in the next few months? That is Tamadoge. Buy TAMA today
Note: Forexschoolonline.com is not a financial advisor. Do your research before investing your funds in any financial asset or presented product or event. We are not responsible for your investing results.


Leave a Reply