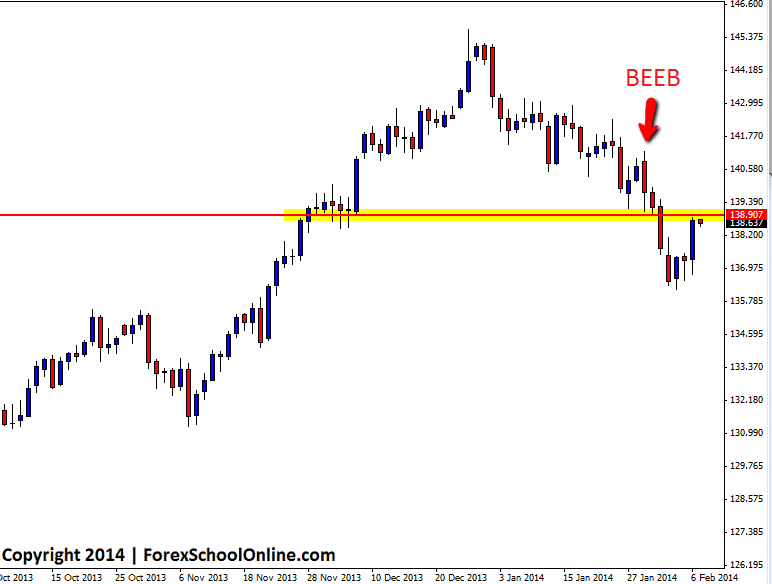
Recently in this blog we discussed a Bearish Engulfing Bar (BEEB) that had formed on the EURJPY daily chart that was looking to send price lower if price could confirm the signal and break the low of the BEEB. You can find the original post here; EURJPY Fires of Bearish Engulfing Bar. Price did confirm the BEEB and once price broke lower it smashed lower and moved into the near term support.
Price has since found a support level and started a reversal higher and back into the BEEB’s low where price broke out. This BEEB low could act as a old support and new resistance level because this area is a daily price flip as well as a longer term weekly support and resistance level. As I write this post, price is testing this level looking to either break back higher or reject with bearish price action and move back lower in-line with the most recent bearish momentum.
Traders who like to trade with the recent momentum could look to target this level to hunt for price action trades. For any possibly trades to be confirmed, high probability price action triggers would have to be printed such as the ones taught in the Forex School Online Members Price Action Courses.
The trend on the 4hr chart of this pair is clearly down and taking a short trade on the 4hr chart would be taking a clear trend trade. This same daily new resistance level also lines up with the 50% Fibonacci level on the 4hr chart, so should this level hold as a new resistance level and high probability price action form, this could be a solid area to take short trades from the on intraday charts.
EURJPY Daily Chart

EURJPY 4hr Chart


Leave a Reply