The AUDUSD market started the week by presenting only minimal profit to traders. However, as little as the profit in this market seems, one thing is certain: it has been consistent to this point. Therefore, let’s devote more study to this market.
Major Price Levels:
Top Levels: 0.6671, 0.6700, and 0.6740
Floor Levels: 0.6650, 0.6620, and 0.6600

AUDUSD Buyers are Wining, But With Less Vigor
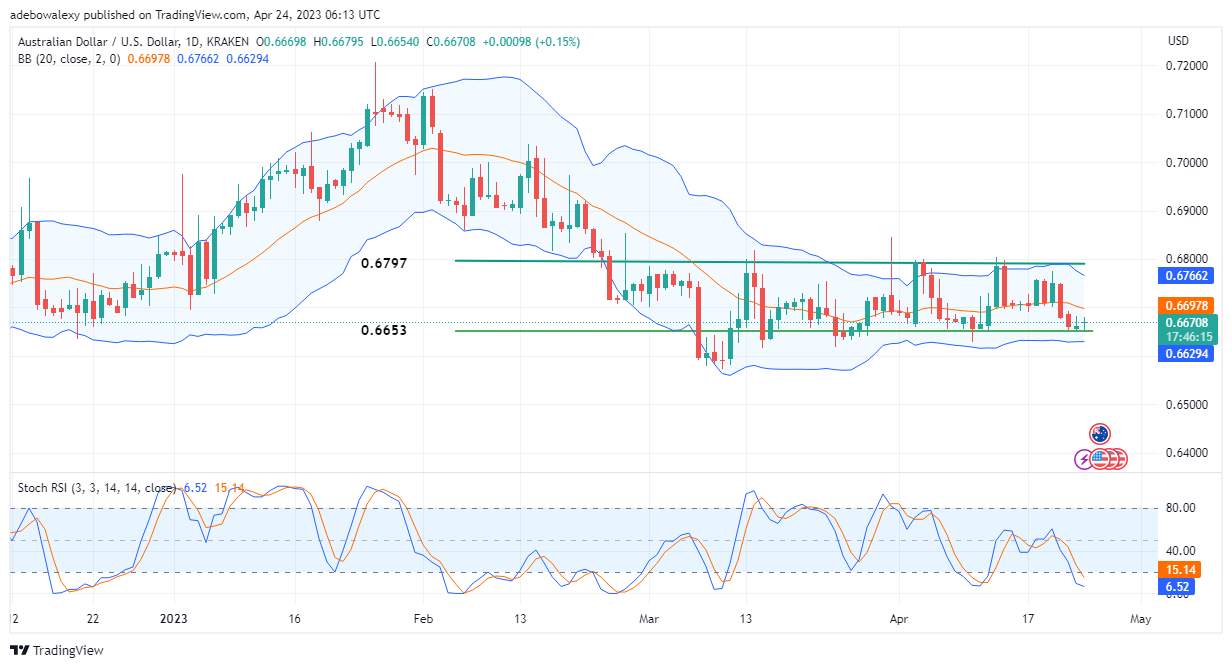
Price action in the daily AUDUSD bounced off the support at 0.6653 as soon as trading activities started for the week. However, buyers seem to be growing thinner in the subsequent session. The last price candle on this chart seems more like a spinning price candle, and it suggests that buyers are encountering some opposition. Furthermore, the Stochastic Relative Strength Index (RSI) curves are still diving into the oversold region. Nevertheless, attention should be paid to the leading RSI line. The minimal gain on the market has caused this line to bend a bit sideways, as if attempting a crossover. This is hinting that upside traction may increase if upside forces get stronger.

AUDUSD Price Action Approaches a Technical Resistance Level
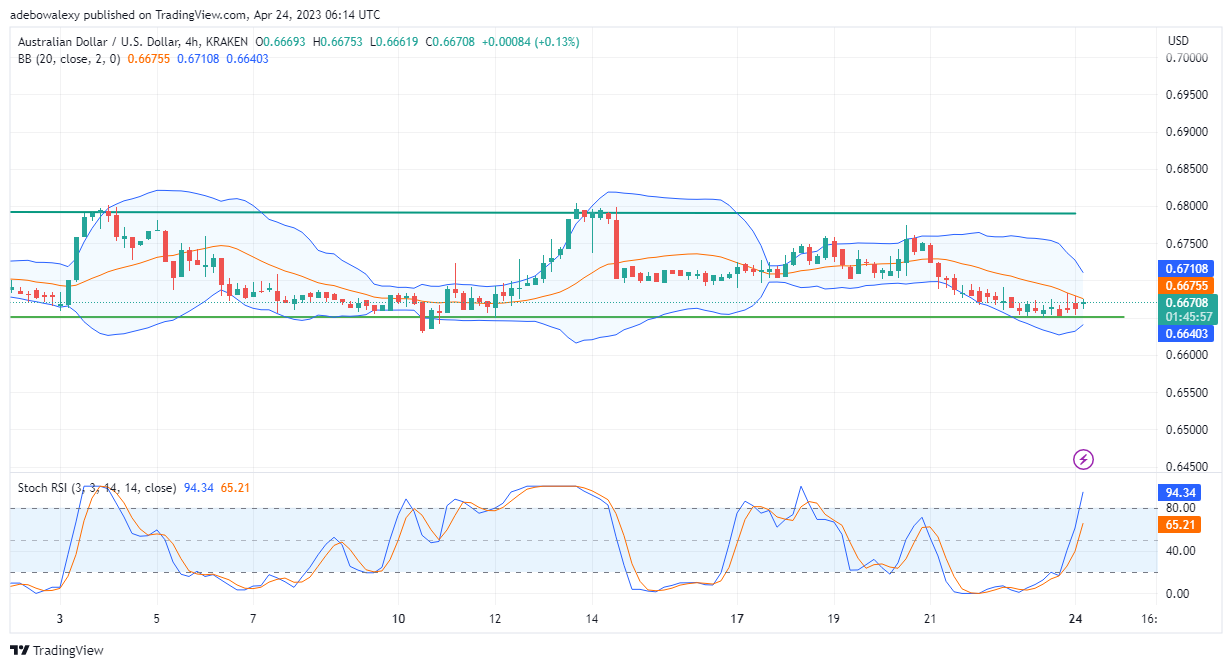
On the AUDUSD 4-hour market, price action is now testing the middle band of the Bollinger Bands indicator. However, with such a moderate move, the RSI indicator curves are already flying high into the oversold region. Consequently, this indicator appears to be too sensitive to changes on this front. But if buyers are able to break the resistance at 0.6676, more profit may be recorded towards the 0.6711 mark. Additionally, traders should keep tabs on fundamentals coming from Australia for more upside impetus.
Do you want to take your trading to the next level? Join the best platform for that here.


Leave a Reply