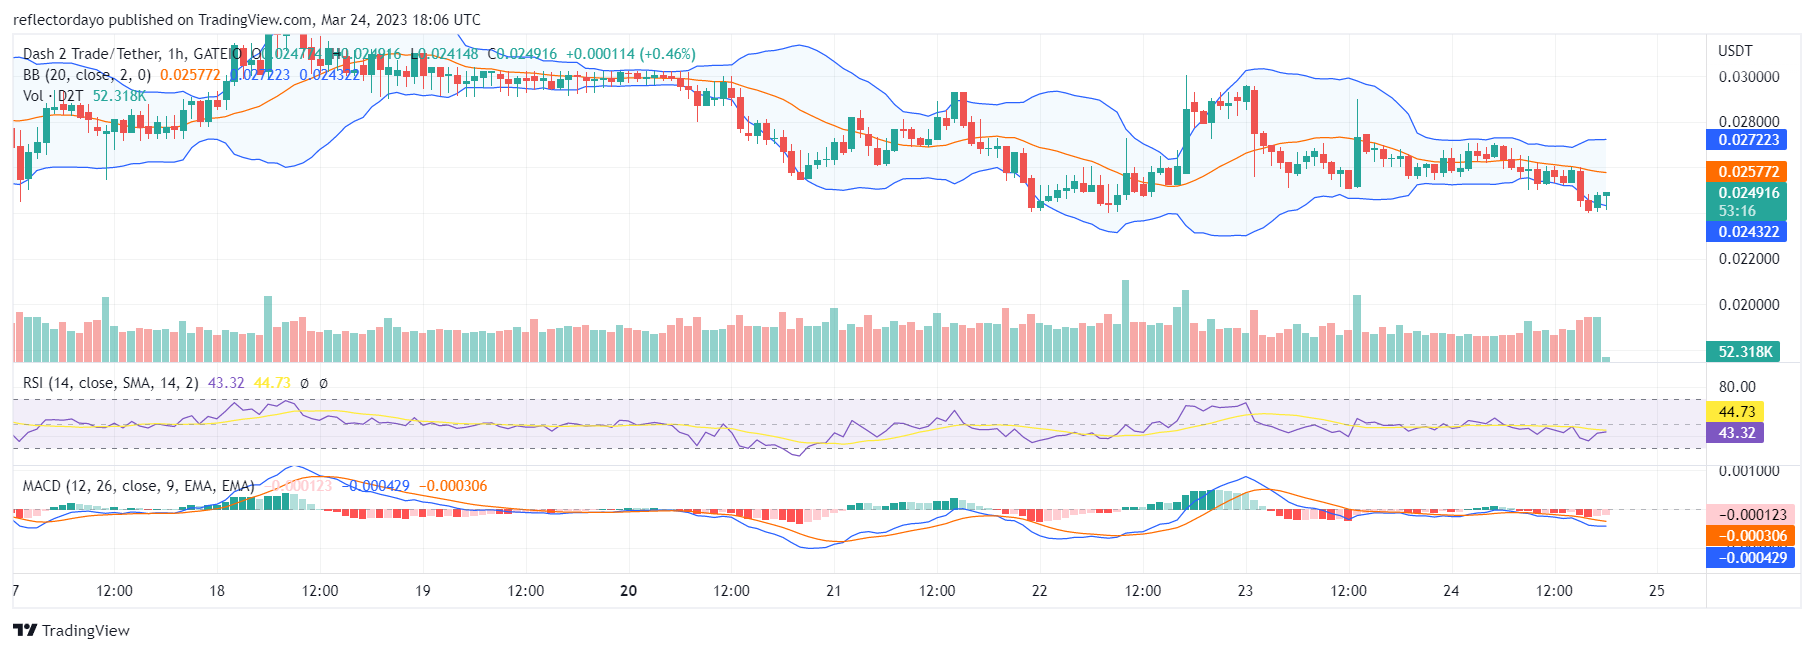
The $0.024 level is the March 16 support level, from where the bull market launched a significant move to capture the $0.03 price level. The bulls were so ambitious at that time that they tested the threshold of the $0.035 price level. The bullish price at $0.035 was rejected, and the progress of the bull market was pegged at the $0.03 resistance level. The Dash 2 Trade market bounced off this key support level again on March 22 but was unable to break through the resistance. The market is bouncing off this level yet again, and we should see a breakout this time.
Key Levels
- Resistance: $0.060, $0.065, and $0.070
- Support: $0.020, $0.0025, and $0.030
Dash 2 Trade (D2T) Price Analysis: The Indicators’ Point of View
Currently, the sentiment across the three indicators used for this analysis is bearish. According to the Relative Strength Index (RSI), the market ranges at around level 40. The momentum is not too strong. This is because the bulls are still very active in this market, as they engage the bears in a tug-of-war and prevent a steep dive in the price. Judging by the previous behavior of the market at the $0.024 price line, we can expect the bull market to bounce back in an attempt to reclaim the $0.024 price level.

D2T/USD Short-Term Outlook: (1-Hour Chart)
From this outlook, we discover that the bear market is on the decline. The Moving Average Convergence and Divergence (MACD) is quick to reflect the weakness in the bear market. The negative histograms are beginning to appear in faded red. This means bulls are coming back into the market and the bull market is recovering. The bulls are strong around the $0.024 price level.
Join the Dash 2 Trade community of over 70,000 investors for trading tips, forecasts, and social analytics to help you make wise decisions.
https://twitter.com/dash2_trade/status/1639235734812114944
Do you want a coin with great potential for enormous returns? Dash 2 Trade (D2T) is that coin. Buy D2T now!


Leave a Reply