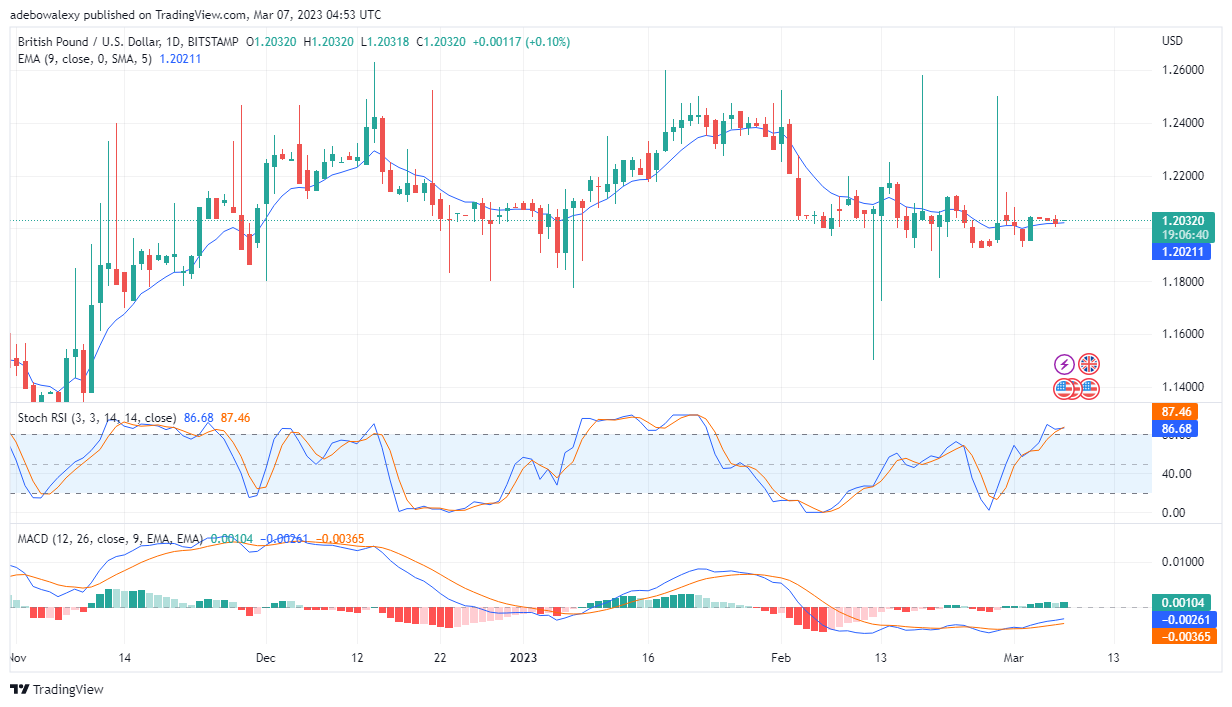
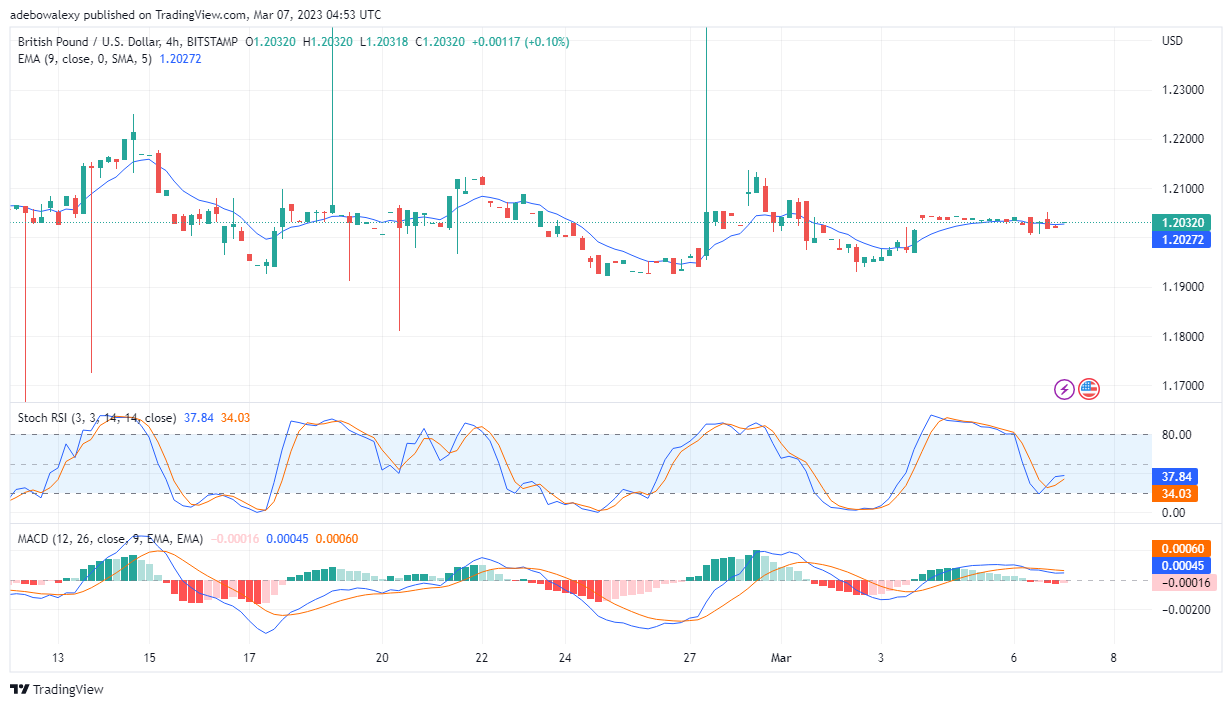
About 5 trading sessions ago, price action witnessed a moderate upside move. However, since then, headwinds have pushed back at price action; though with minimal effect. Presently, it appears as if price action is trying to stay above an important support level of 1.2027. So, let’s get a closer look.
Major Price Levels:
Top Levels: 1.2032, 1.2062, and 1.2100
Floor Levels: 1.2027, 1.2007, and 1.1983

GBP/USD Attempting an Upside Retracement
On the daily GBP/USD market, and about five trading sessions ago, price action crossed above the 9-day Exponential Moving Average curve. Nevertheless, downward forces have caused the price to retrace towards the EMA line as a support at 1.2027. In the ongoing session, it appears as if buyers are trying to advance prices above the 1.2027 mark. This could be seen as a green, dashed-shaped price candle showing up on this chart. Also, the MACD indicator is revealing that upside forces have gathered some momentum. Additionally, the Stochastic RSI indicator lines are oriented upwards, even when both the leading and lagging lines are merged. Consequently, traders can predict that the pair’s price may proceed upward with minimal vigor.

GBP/USD Price Retains Position Above an Important Support
The GBP/USD pair continues to trade above the 1.2027 mark. Also, there are fair signs that price action may proceed upward, though with minimal strength. The lines of the applied Stochastic RSI indicator have moved closer to each other but still maintain an upward bearing in the oversold region. Furthermore, the MACD indicator lines are now close to each other, above the equilibrium level. The lines of the MACD indicator are moving sideways, while the short histogram bars of this indicator now turn pale and are growing shorter below the equilibrium level. Considering the indications coming from trading indicators, prices in this market may slowly move toward the 1.2100 price mark.
Do you want to take your trading to the next level? Join the best platform for that here.


Leave a Reply