GBP/USD price action extends its consolidation move. Also, for some time now, the price action seems to have lacked the needed push to rise toward the ceiling of the sideways price channel. Bears appear to be dominant at this point time. For more insights into this market, let’s take a closer look at things.
Major Price Levels:
Top Levels: 1.2097, 1.2124, 1.2164
Floor Levels: 1.2076, 1.2046, 1.2000

GBP/USD Price Action Lacks a Clear Direction
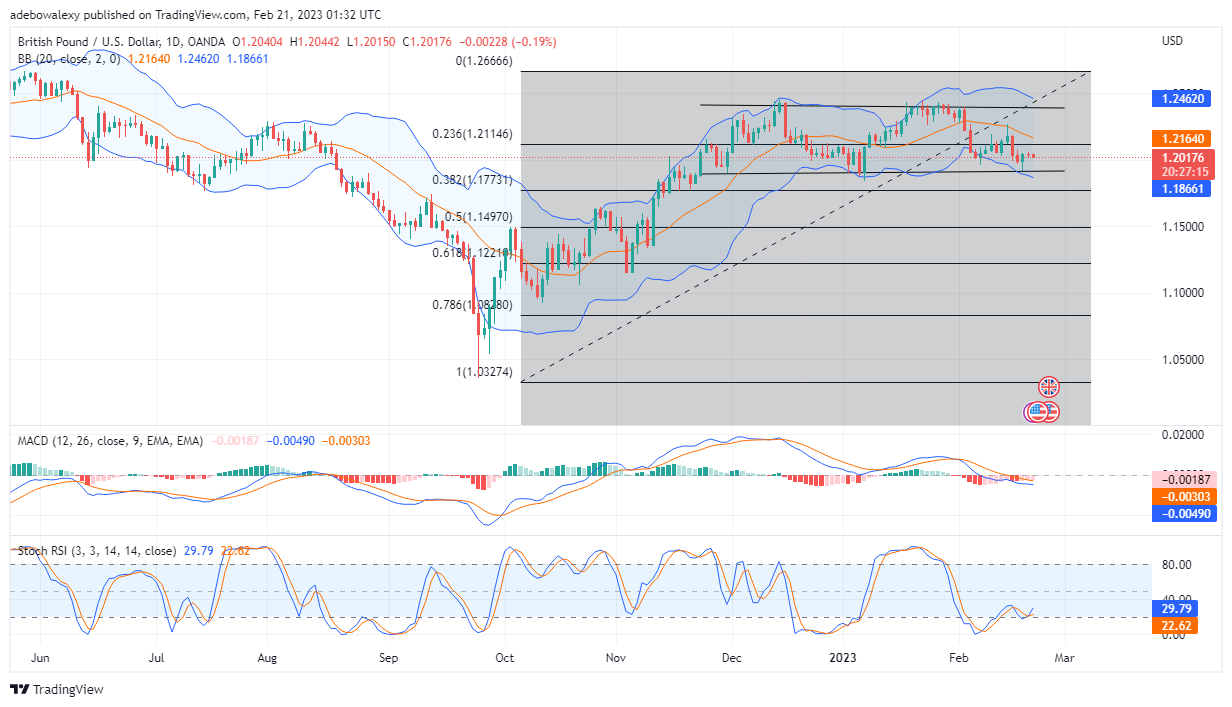
In recent times, it appears that the GBP/USD market lacks direction. This has resulted in the pair’s price trading below the 1.2110 price level. Price action has retreated below the. 23.60 Fibonacci level, after breaking the same level to the upside. The MACD lines remain below the equilibrium level at -0.00303 and -0.00490. Nevertheless, it is important to note that these lines are now moving sideways, while the MACD histogram bars are now pale red. Also, the lines of the RSI are now moving upward following a crossover. Combining the signs on the RSI with the MACD, one may suspect that price action may be preparing to take an upside path. However, this market still appears flat and has no clear direction.

GBP/USD Price Lands on an Important Support Level
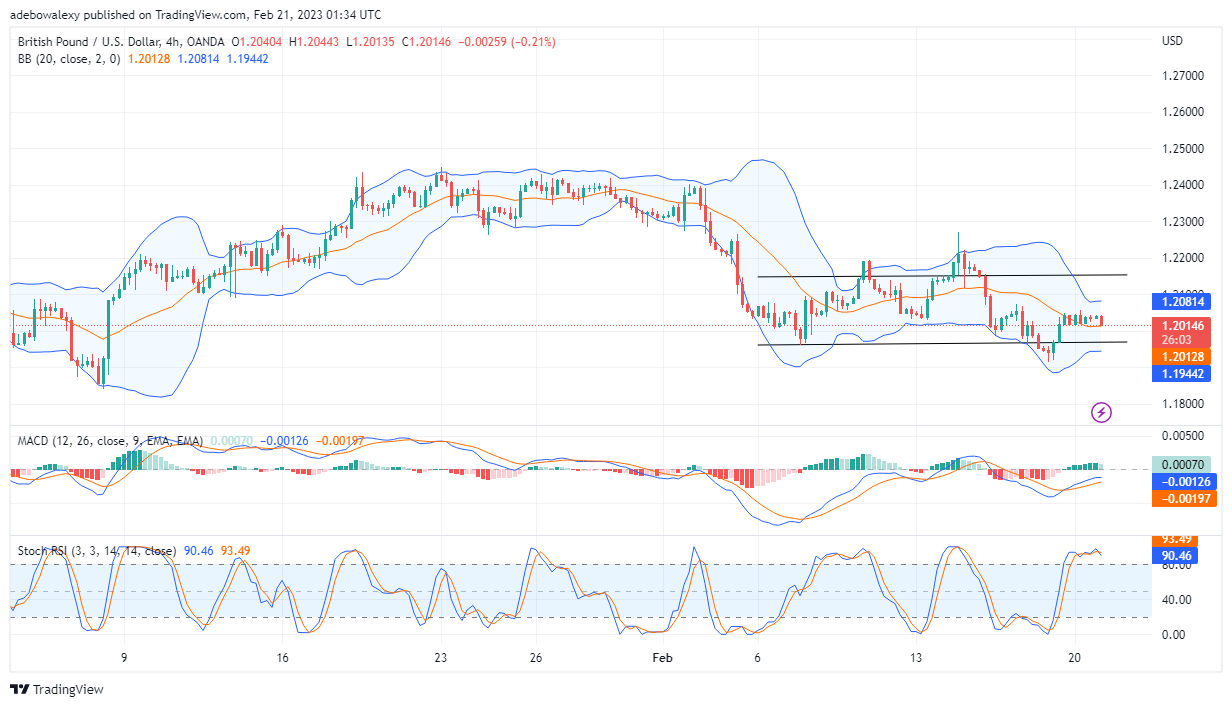
On the 4-hour market, GBP/USD price action has risen above the middle band of the Bollinger Band indicator. However, in this session, a longer bearish price candle has plunged the price to the middle limit of the Bollinger Band indicator. Consequently, the market appears mixed up. This is because bears are more dominant now, and bulls seem to lack the strength to move the price up significantly. Furthermore, the RSI indicator dampens upside expectations at this point, as its lines have become more mangled and have eventually given a bearish crossover. Also, the MACD lines seem to have started moving sideways below the 0.00 mark very recently. Consequently, traders can expect GBP/USD to fall below the 1.2000 price mark.
Do you want to take your trading to the next level? Join the best platform for that here.


Leave a Reply