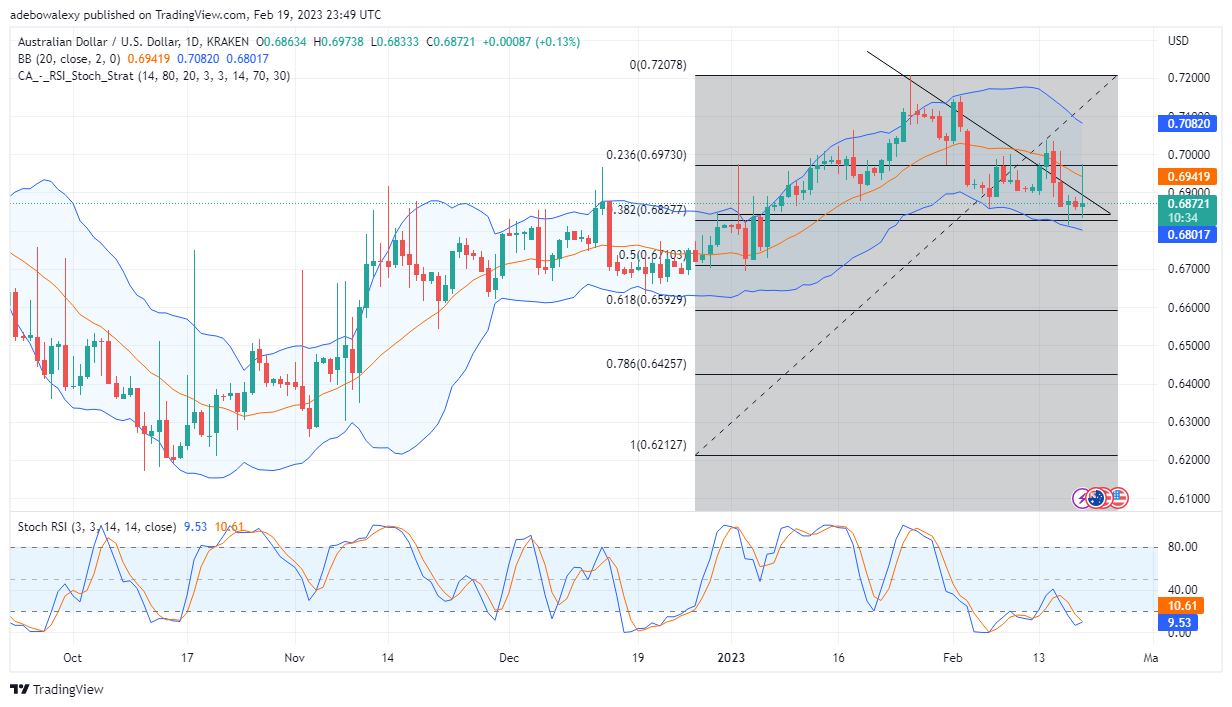
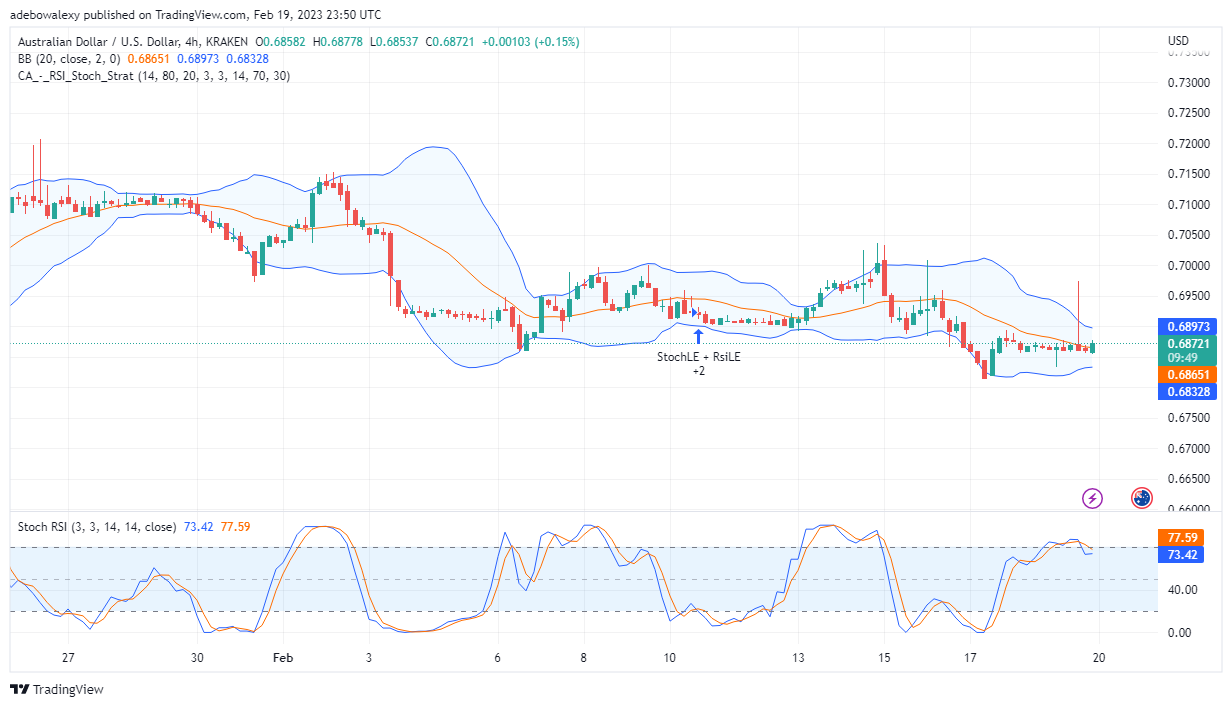
Price action in the AUD/USD market seems to be gearing up toward retracing the 0.6900 resistance level. Trading indicators are also aligning with this opinion, even as trading activity continues.
Major Price Levels:
Top Levels: 0.6872, 0.6900, 0.6940
Floor Levels: 0.6850, 0.6820, 0.6800

AUD/USD May be preparing to go Bullish
On the AUD/USD daily market, price activities seem to be proceeding in a falling wedge pattern. By implication, this suggests that once an upside breakout occurs, the price may retrace significantly upward. The last price candle here is a bullish one, and it now appears to be getting near a breakout of the falling wedge triangle. In addition, the lines of the MACD indicator are now nearly performing an upside crossover in the oversold zone. Consequently, traders can predict that a significant upside move may be nearby.

AUD/USD Price Upside Promises Keep Growing Stronger
Moving to the 4-hour market, the AUD/USD market continues to show upside promise. On this front, price action has been able to cross above the middle limit of the applied Bollinger Band. Likewise, it could be seen that the curves of the RSI indicator are now above the 70 mark of the indicator. In addition, the latest price development, which resulted in the appearance of a moderate-sized green candle, seems to have initiated a move for an upside crossover on the RSI indicator. Also, given the current position of the pair’s current price, traders can anticipate the eventual occurrence of the crossover. Subsequently, this will result in the AUD/USD price approaching the 0.6920 mark, or even exceeding it.
Do you want to take your trading to the next level? Join the best platform for that here.


Leave a Reply