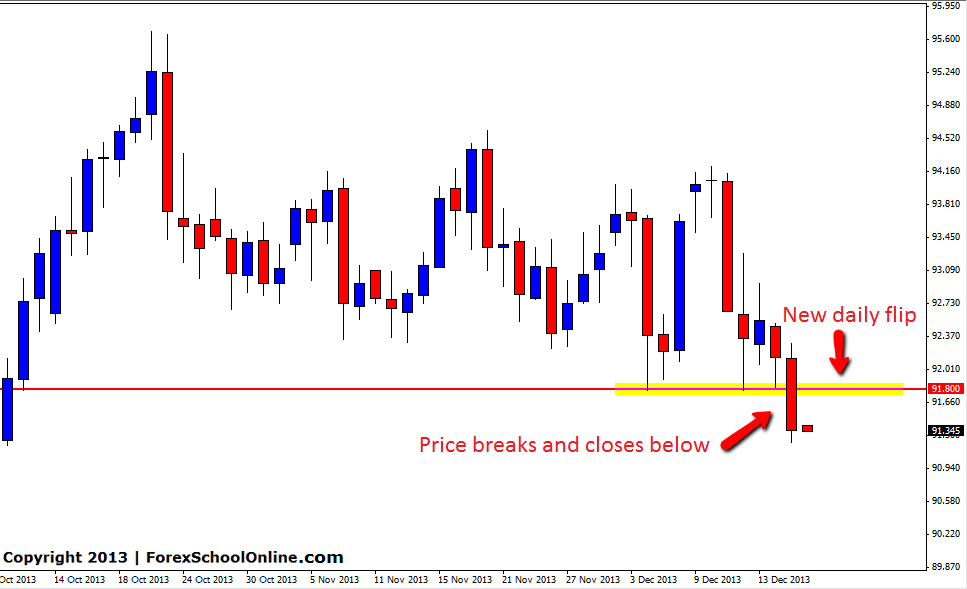
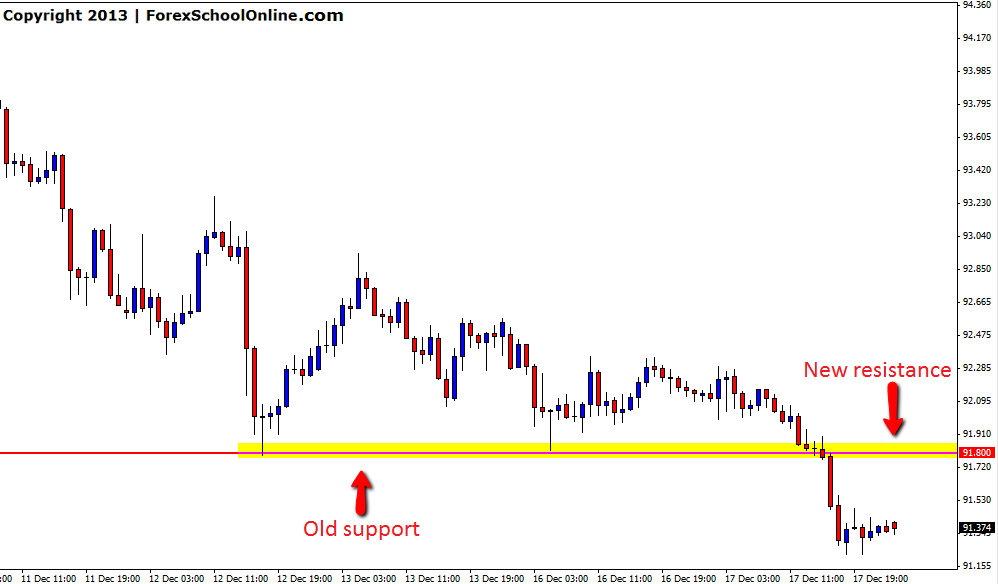
The AUDJPY has overnight smashed through the support level on the daily price action chart and most importantly closed below signalling that at this stage their was enough price action order flow pressure for this level to become a price flip level and flip from a support level to a new short term resistance. The crucial factor was that price closed below this level. Quite often price will flirt with these levels and move through them on the daily chart, but close back above, but until we get a solid close through like we have here, the level is not broken. I discuss this in an in-depth trading tutorial for traders how this important trading rule works here: Why Price Closing Above and Below Key Levels is So Important
What does this mean for traders looking to trade this pair?
Traders looking at this pair can watch to see if price moves higher and back into this new price flip area to see if holds as a new resistance area. If price moves back higher and into this new resistance area it could act as a really key area to start targeting new short trades on intraday charts such as the 1hr chart. For any possible intraday trades to be confirmed, high probability price action setups would have to be printed. Making a trade on the intraday chart would mean entering at a key daily resistance area, but also with the recent intraday momentum. If price was to move back into this area and simply slice through this area with no solid price action, this could possibly signal that the level has flipped again, so traders need to stay on their toes at all times.
AUDJPY Daily Chart


Leave a Reply