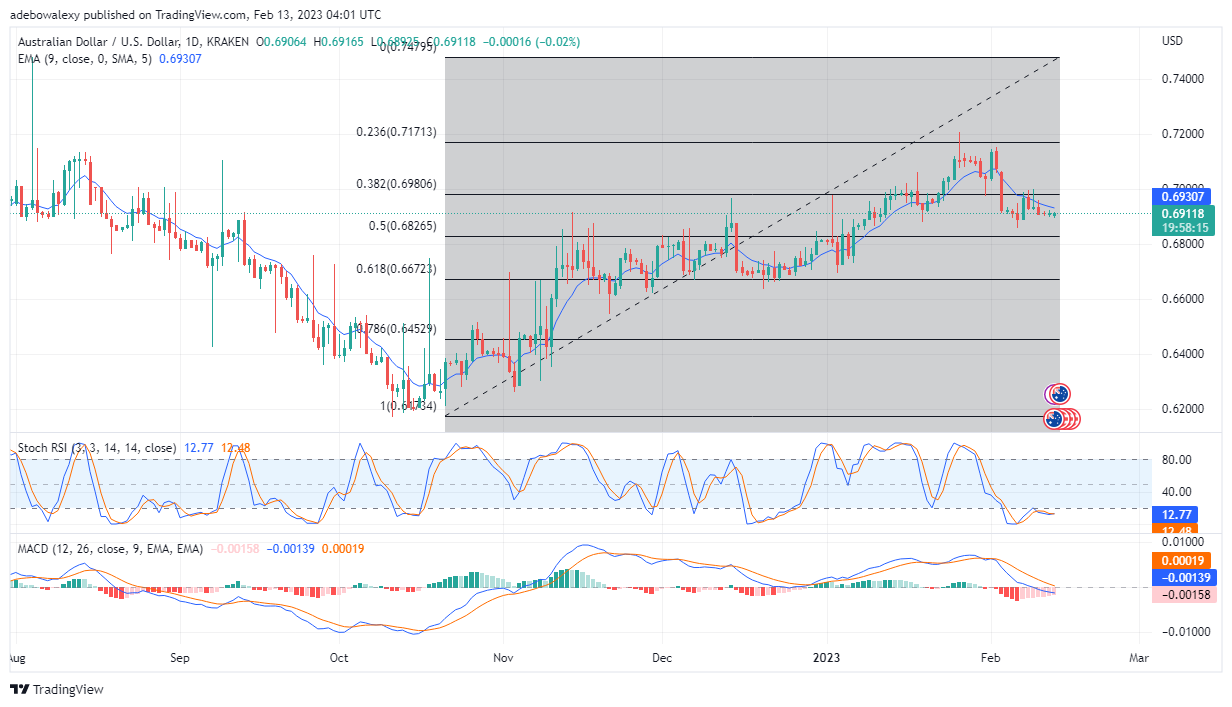
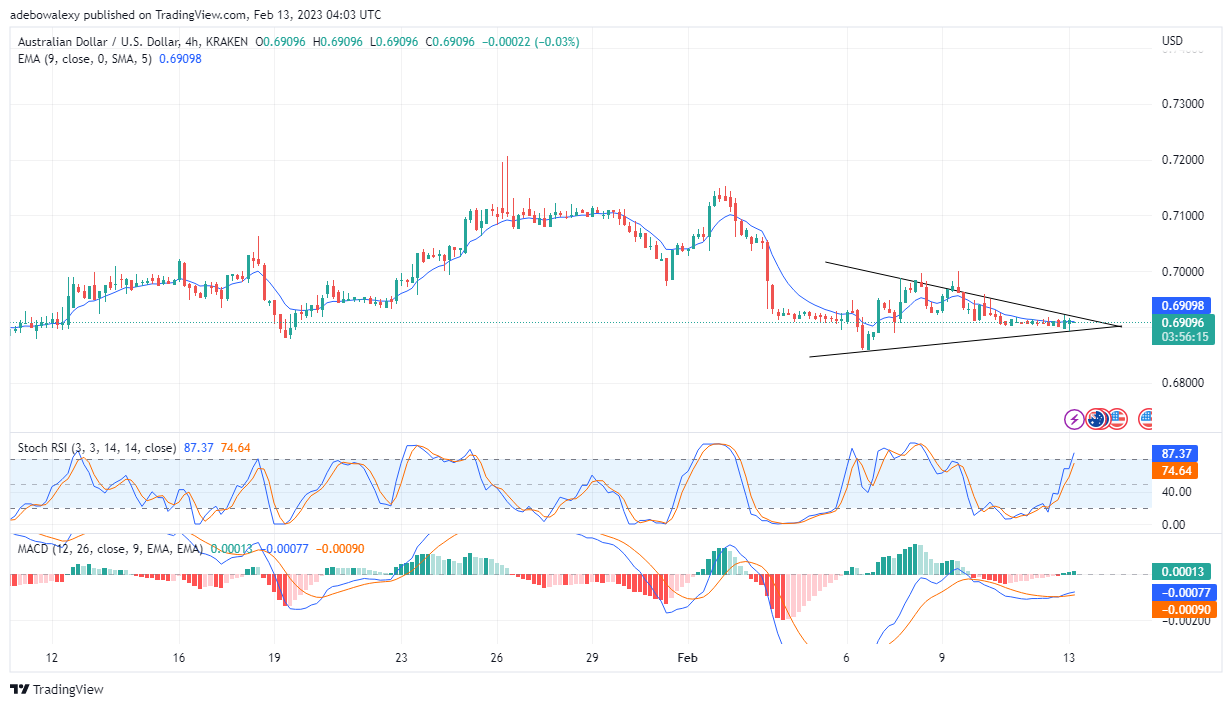
AUD/USD now trades under the 0.7000 mark, near the 0.6900 price mark. However, in this ongoing session, it appears as if the pair is preparing to move upward toward the 0.7000 mark. Let’s further study this market to get a better understanding of price movements.
Major Price Levels:
Top Levels: 0.6911, 0.6941, 0.6981
Floor Levels: 0.6900, 0.6880, 0.6860

AUD/USD Price Is Already Eying the 0.6930 Level
On the daily AUD/USD market, the pair currently trades at 0.6911. Also, a green price candlestick has formed for this session. Although this price candle looks quite small, it at least shows that bulls are making upside attempts. The RSI lines appear to be attempting a crossover after staying close to each other for some time now. Additionally, the MACD indicator is also revealing a decrease in downward momentum via its histogram bars, which have started turning pale red. Although price action in this market is still below the 9-day MA line, if buyers can push the price just above the MA, this will open the door for more upside gains in this market.

AUD/USD Buyers Are Making Progress in Trying to Break the Resistance Formed by the MA Line
The price action in the AUD/USD market has moved closer to the MA line. Consequently, this implies that price action may be about to secure strong support. The last price candle on this chart is now testing the 9-day MA line. Furthermore, the Stochastic RSI curves have recovered their upward bearing, after they attempted a bearish crossover. Also, the MACD indicator is now slowly revealing that bullish momentum is growing in this market. This could be observed through its lines and histogram bars. Since all market signs are pointing upwards, traders can expect price action to move near the 0.7000 mark shortly.
Do you want to take your trading to the next level? Join the best platform for that here.


Leave a Reply