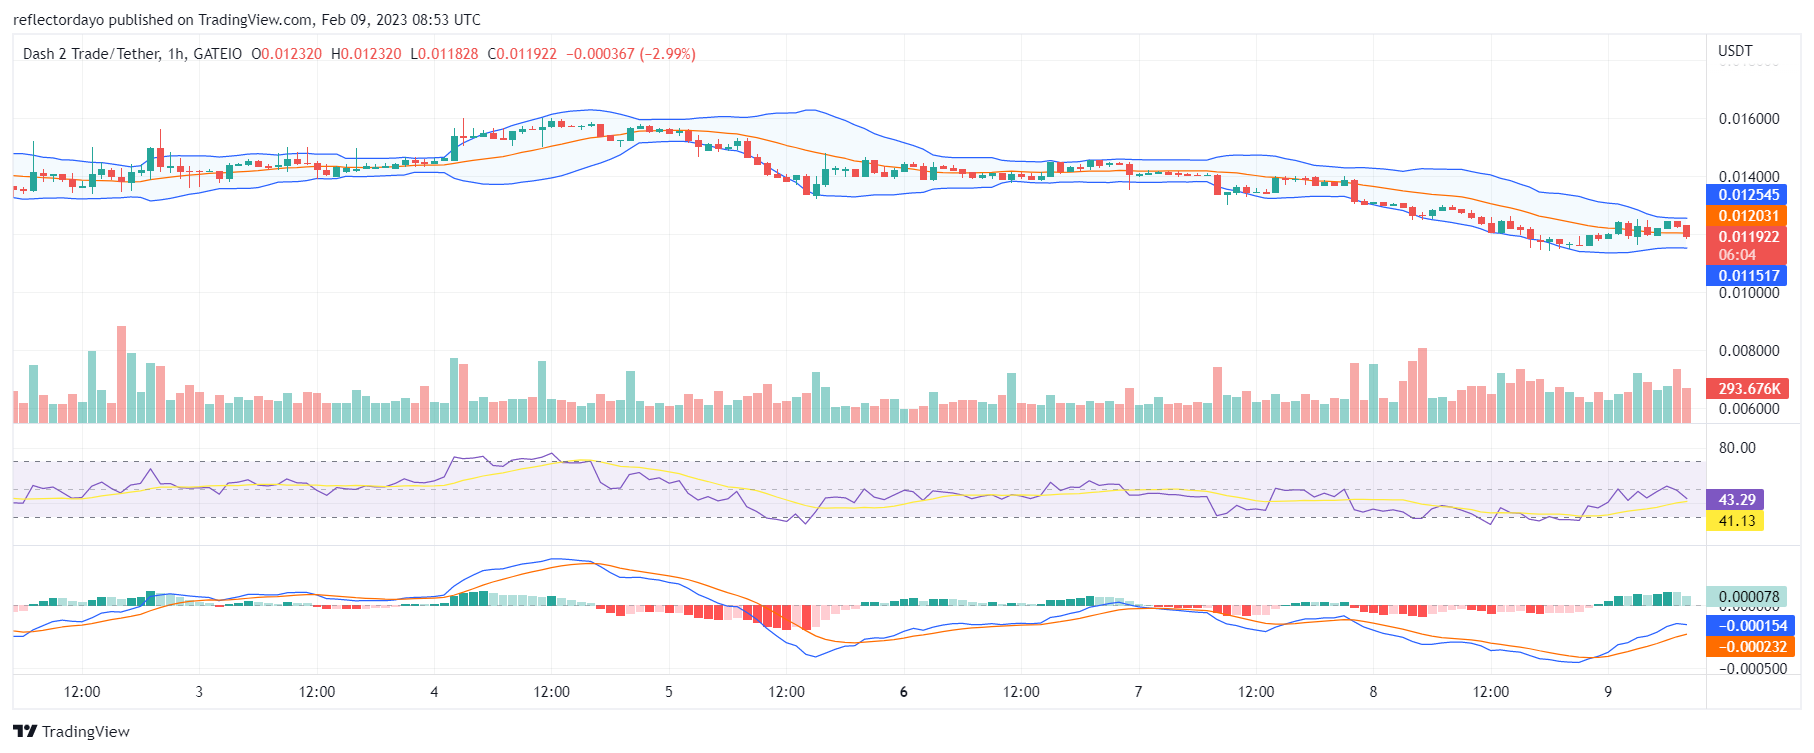
The bear market has hit a brick wall at $0.0116 and the bull market is bouncing back after forming a strong base at the support level. However, the selling pressure is still strong, but the D2T buyers are pushing through. The appearance of a plus-sign Doji candlestick pattern reflects the struggle as the demand line attempts to push back the supply line.
Key Levels
- Resistance: $0.019, $0.020, and $0.025
- Support: $0.010, $0.076, $0.005
Dash 2 Trade: From the Indicators’ Point of View
The market, according to the Bollinger Bands indicator, is not a fast-declining market. This is because the price is bouncing back due to the increasing buying pressure. The Moving Average Convergence and Divergence portray very tiny histograms, and they are near the zero line boundary. This means the bullish price recovery is in progress. The Relative Strength Index still measures market momentum at level 35.

D2T/USD Short-Term Outlook: The Bullish Price is Bouncing Back (1-Hour Chart)
From the standpoint of the 1-hour timeframe, we noticed the price action crossing above the 20-day moving average. The increasing buying pressure in the market is illustrated by the contraction of the Bollinger Bands. The buyers are catching up with the sellers. They had initially stopped the bearish progress and now, they are pushing the price to the upside.
With Dash 2 Trade customizable watchlists, you can keep track of your deals and remain organized. With their beginning or premium tier subscriptions, you can access this feature and more.
💼 Stay organised and on top of your trades with Dash 2 Trade's customisable watchlists.
📊 Get access to this feature and more with our starter or premium tier subscriptions.Visit https://t.co/ExvBBjKIU6 to learn more about our membership tiers!#crypto #trading pic.twitter.com/SpbqOOrTzK
— Dash 2 Trade (@dash2_trade) February 9, 2023
Want a coin that has a huge potential for massive returns? That coin is Dash 2 Trade. Buy D2T now!


Leave a Reply