• Skip to primary navigation
  • Skip to main content
  • Skip to primary sidebar
  • Skip to footer

ForexSchoolOnline.com

Learn to Trade Forex Online

  • Compare Brokers
    • Broker Type
      • Paypal Brokers
      • Swap-Free Brokers
      • Low Spread Brokers
      • ECN / STP Brokers
      • Market Maker Brokers
      • Non Dealing Desk Brokers
      • Low Minimum Deposit Brokers
    • Country
      • Brokers for Australia
      • Brokers for South Africa
      • Brokers for the UK
      • Brokers for the US
      • Brokers for Nigeria
    • Regulation
      • FCA Regulated Brokers
      • ASIC Regulated Brokers
      • FSCA Regulated Brokers
      • CFTC Regulated Brokers
    • Platform
      • MT4 Brokers
      • MT5 Forex Brokers
    • Strategies
      • Hedging Forex Brokers
      • Scalping Forex Brokers
      • Carry Trade Forex Brokers
      • Brokers for Indicators and EA’s
  • Start Here
    • Start Trading Guide
    • Beginner Trading Lessons
  • Free Forex Course
    • Public Login
    • Register
    • Password recovery
  • Lessons
    • Strategies
    • Videos
    • MT4 Guides
    • Money Management
  • Trade Setups
  • Tools
    • Correct Free Demo Charts
    • Forex Journal Download
    • Position Size Calculator
    • FULL List of Tools
    • Forex Demo Accounts
  • Price Action Guide
  • Free Course

AUDJPY: Will Go Down from Resistance! Sell!

Johnathon Fox
01/29/2023 | UPDATED ON: 01/29/2023

Upward pressure still dominates both the higher and medium-term time frames.
It is very likely for AUDJPY to resume the bearish trend as the market is overbought.

AUDJPY Weekly Price Analysis – January 29
The AUDJPY pair is on the verge of more downsides. If the bears’ momentum should break down the $87.411 support mark, the Yen price may further drop to an $86.000 lower support value and this may invalidate any bullish signs.

AUDJPY Market
Key Levels:
Resistance levels: $95.000, $96.000, $97.000
Support levels:   $91.000, $90.000, $89.000
AUDJPY: Will Go Down from Resistance! Sell!
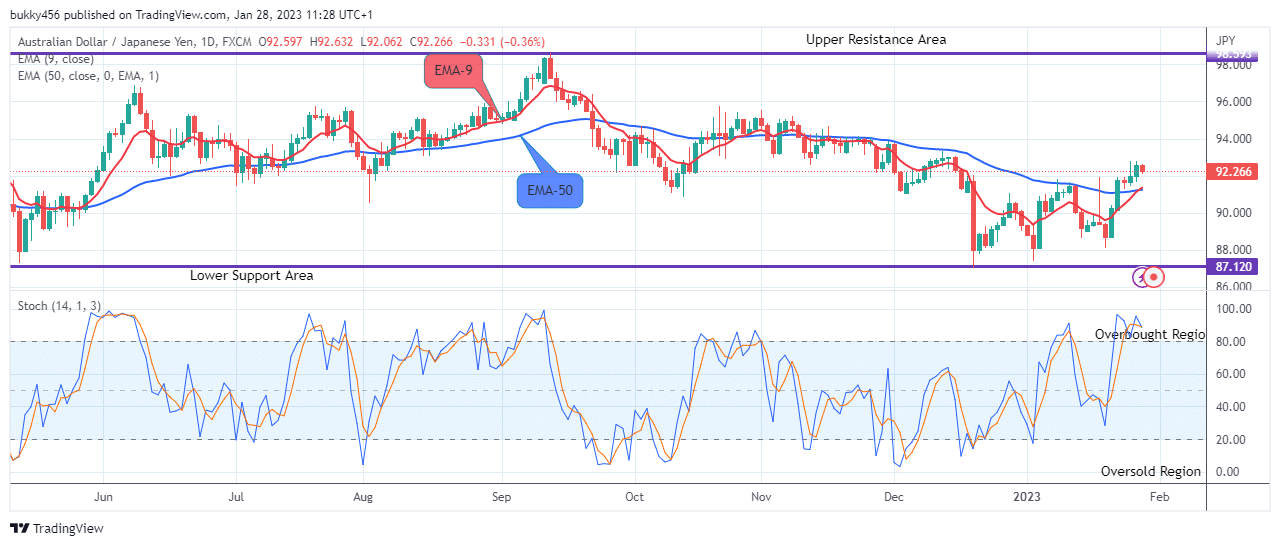
AUDJPY Long-term Trend: Bullish
On the daily chart, the AUDJPY pair is trading above the moving averages, which means that it’s in a bullish trend zone. The bulls’ pressure on the currency pair at the $92.813 supply value further led to an increase in the price of the Yen during yesterday’s session and sustained it.

The bears overrode the bullish momentum and drove the price of the Yen down to the $92.597 support level above the moving average lines as the daily chart resumes today.

Impulse move by the sell traders further dropped the price down to the $92.062 low value above the supply trend levels; this implies that the bears are returning to the market in a grand style to stage a play. If additional effort is added by the bears, the bearish trend will reach a psychologically key level at the downside.

Furthermore, it is very likely for the AUDJPY price to continue the drop as the daily stochastic signal is now pointing upwards in the overbought region, this means that the buying pressure is exhausted; we can then expect sellers to push the price down and the $86.000 lower support value might be the target in the nearby days in its long-term scenario.

AUDJPY Medium-term Trend: Bullish
On the 4-hourly chart, the AUDJPY remains is in a bullish trend zone. The Yen’s price is trading above the two EMAs despite the moves from sellers.
AUDJPY: Will Go Down from Resistance! Sell!
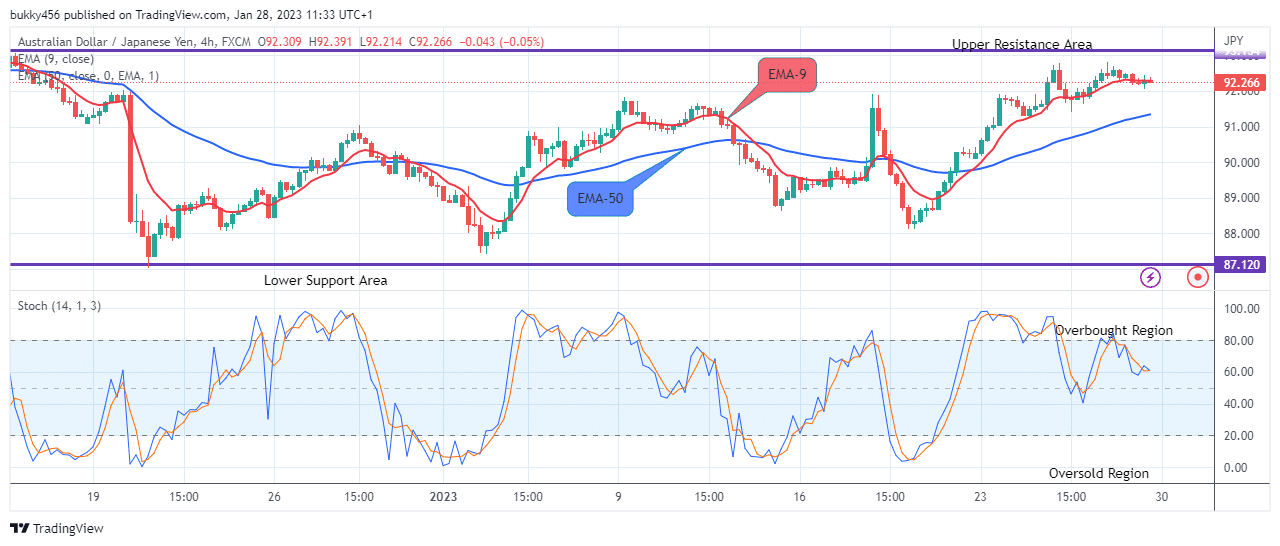
Activities from the bulls at the $92.701 high value during yesterday’s session have led to their upward strength in recent times. Nevertheless, it seems the bears will take over the price of AUDJPY soon and push the price down as the market now trades at the overbought region.

Today’s 4-hourly chart opens with a bearish candle at the $92.156 support above the two EMAs.

Increase pressure from the short traders further dropped the price of AUDJPY down to a $92.214 low value above the moving averages, this implies that the bears are returning to the market to dominate and control the market prices soon.

In addition to that, the signal from the stochastic oscillator pointing downwards in the overbought region is an indication that the buying pressure has ended. This will draw sellers to continue the low-dips and in this case, the bearish correction phase may hit the $86.000 lower support mark in the nearby days in the medium-term perspective.

Note: Forexschoolonline.com is not a financial advisor. Do your research before investing your funds in any financial asset or presented product or event. We are not responsible for your investing results.

Recommended Broker

  • Broker
  • Min Deposit
  • Benefits
  • Score
  • Visit Broker

$200

T&Cs Apply
  • The Lowest Trading Costs
  • 50% Welcome Bonus
  • Award-winning 24 Hour Support
5
Trade Now FreeBets Reviews
Reviews

About Johnathon Fox

Johnathon is a Forex and Futures trader with over ten years trading experience who also acts as a mentor and coach to thousands and has written for some of the biggest finance and trading sites in the world.

View all posts by Johnathon Fox →
Previous Post: « Lucky Block Price Prediction: LBLOCKUSD Price Targeting the $0.02000 Upper Resistance Level
Next Post: Lucky Block Price Prediction: LBLOCKUSD Remains Strong above the $0.0001600 Supply Mark »

Reader Interactions

Leave a Reply Cancel reply

Your email address will not be published. Required fields are marked *

Primary Sidebar

Forex School Online

High Probability Price Action Trading

How to make, manage and take profit from trades in the markets

Start Learning (It's Free!)

Turn Your Trades into Winners!

The Price action course is the in-depth advanced training on assessing, making and managing high probability price action trades.

Sign up for Free!

Recommended Broker

  • Broker
  • Min Deposit
  • Benefits
  • Score
  • Visit Broker

$200

T&Cs Apply
  • The Lowest Trading Costs
  • 50% Welcome Bonus
  • Award-winning 24 Hour Support
5
Trade Now FreeBets Reviews
Reviews

Footer

Get Our FREE Course, Bonus Strategies & Indicators!
X
Join Us Now!

Your capital is at risk.

X

CORNERSTONE LESSONS

Forex Trading for Beginners

Price Action Trading

How to Trade Forex

Technical Analysis

Forex Charts

Forex Trading Strategies

Money Management 

Compare Brokers

Best Forex Brokers

Forex Demo Accounts

Best Forex Trading Platforms

Forex Apps

Swap Fee Accounts

MT4 Brokers

CATEGORIES

Forex Videos

Trading Lessons

Weekly Trade Ideas

Start Here Guide

ForexSchoolOnline.com helps individual traders learn how to trade the Forex market

WARNING: The content on this site should not be considered investment advice and we are not authorised to provide investment advice. Nothing on this website is an endorsement or recommendation of a particular trading strategy or investment decision. The information on this website is general in nature so you must consider the information in light of your objectives, financial situation and needs.

Investing is speculative. When investing your capital is at risk. This site is not intended for use in jurisdictions in which the trading or investments described are prohibited and should only be used by such persons and in such ways as are legally permitted. Your investment may not qualify for investor protection in your country or state of residence, so please conduct your own due diligence or obtain advice where necessary. This website is free for you to use but we may receive a commission from the companies we feature on this site.

We Introduce people to the world of currency trading. and provide educational content to help them learn how to become profitable traders. we're also a community of traders that support each other on our daily trading journey

Forexschoolonline.com is not a financial advisor. Do your research before investing your funds in any financial asset or presented product or event. We are not responsible for your investing results.

Copyright © Forex School Online Sitemap  - Privacy Policy - Disclaimers & Terms of Use - CONTACT US