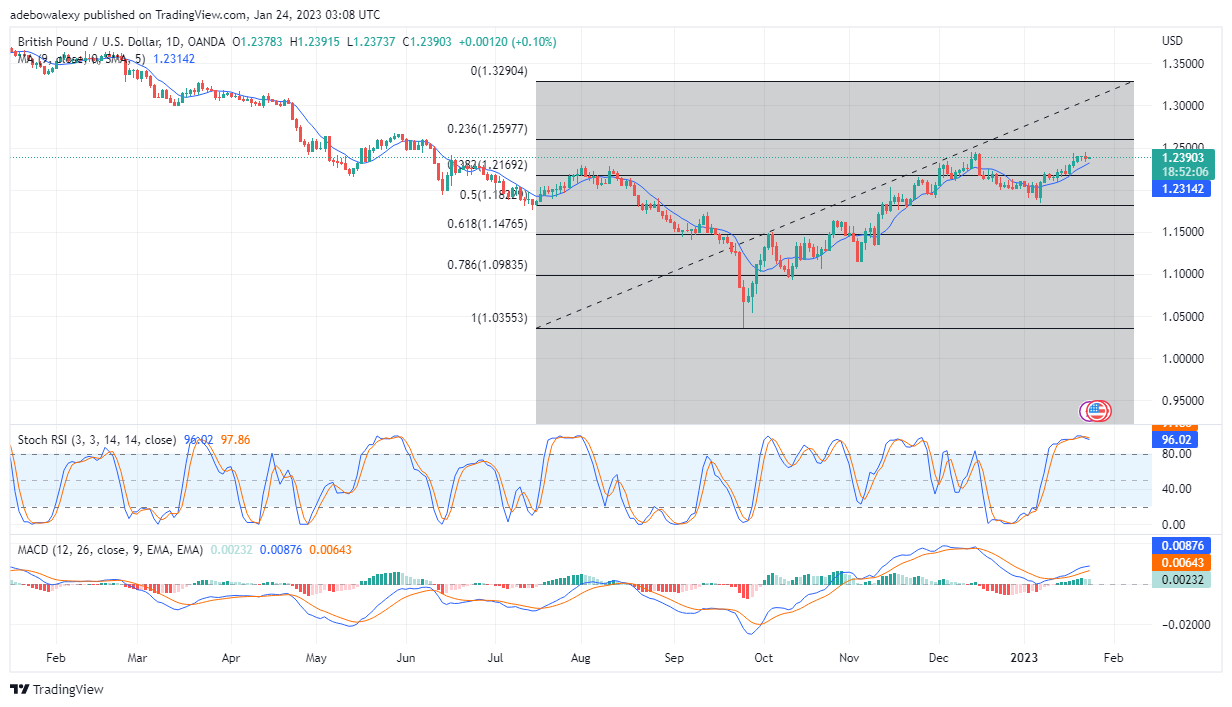
GBP/USD price action successfully broke up the Fibonacci resistance level of 38.20 at 1.2169. However, it seems the pair quickly began losing strength. At this point, price action in the GBP/USD market looks even weaker. Let’s further examine this market to see what may be expected shortly.
Major Price Levels:
Top Levels: 1.2390, 1.2400, 1.2440
Floor Levels: 1.2350, 1.2320, 1.2300

GBP/USD Grabbing Only Minimal Gains at the Moment
The bulls in the GBP/USD daily market are looking quite exhausted. This could be seen as a green dash price candle that has just appeared for this current session. Also, technical indicators continue to reveal the weakness in this market. Although the MACD curves are still above the equilibrium level, their histogram bars are revealing that upside forces are losing strength. This could be perceived through the histogram bars of this indicator. Also, the RSI lines are now moving slightly downward after a crossover in the overbought region. Nevertheless, price action remains above the 9-day Moving Average curve, and this brings little hope that prices may regain upside strength.

GBP/USD Seems Determined to Keep Recording Profits
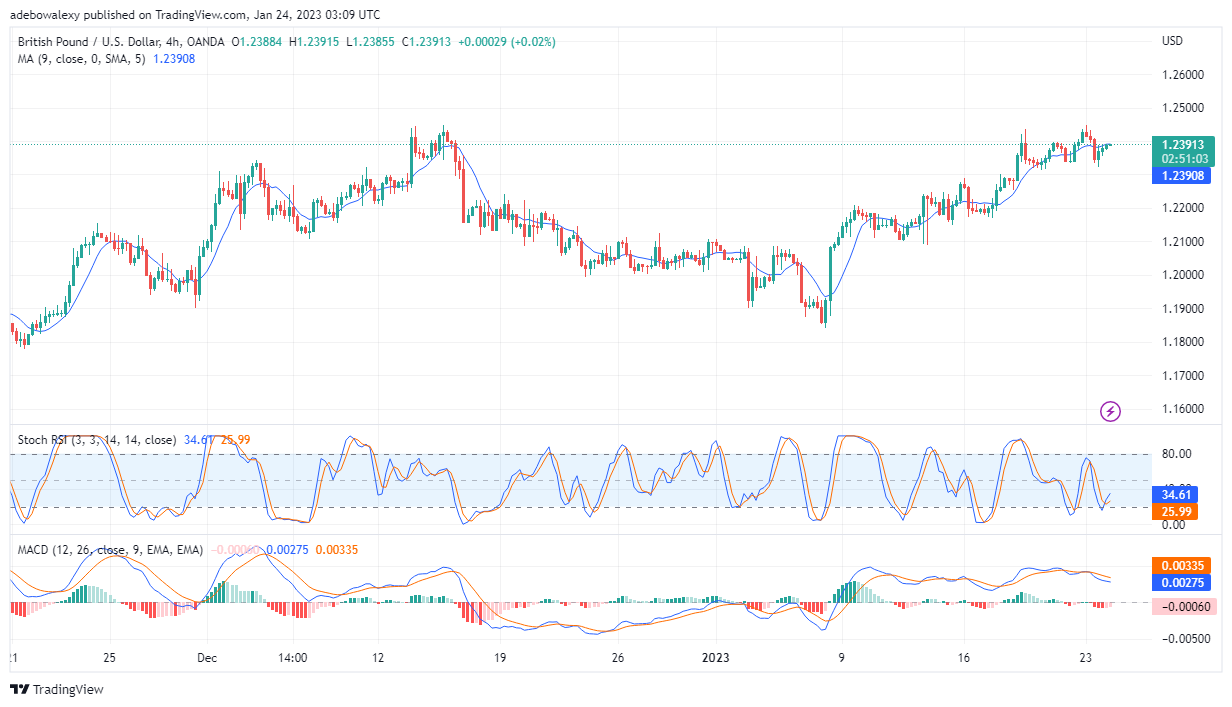
The 4-hour chart reveals that price action seems ready to keep recording profits. Although this market may only bring minimal profits, technical indicators are attesting that prices are on their way up. In this market, the last price candle has aligned the current price with the 9-day MA line. Meanwhile, the MACD and the Stochastic RSI are revealing that the pair’s price is likely to surpass the MA line. The Stochastic RSI line is moving upward after a crossover. At the same time, the MACD indicator lines are now moving almost sideways above the equilibrium point, while the bars of the indicators are revealing that downward forces are losing momentum. Therefore, traders can hope that GBP/USD prices will keep moving upward and toward the 1.2450 mark.
Do you want to take your trading to the next level? Join the best platform for that here.


Leave a Reply