After what seemed like a minimal selling activity in the past four trading sessions, price action has since then ramped up. Interestingly, it appears as if this significant price move may continue.
Major Price Levels:
Top Levels: 142.850, 143.100, 144.500
Floor Levels: 142.00, 141.00, 140.00

EUR/JPY Gains Upside Traction
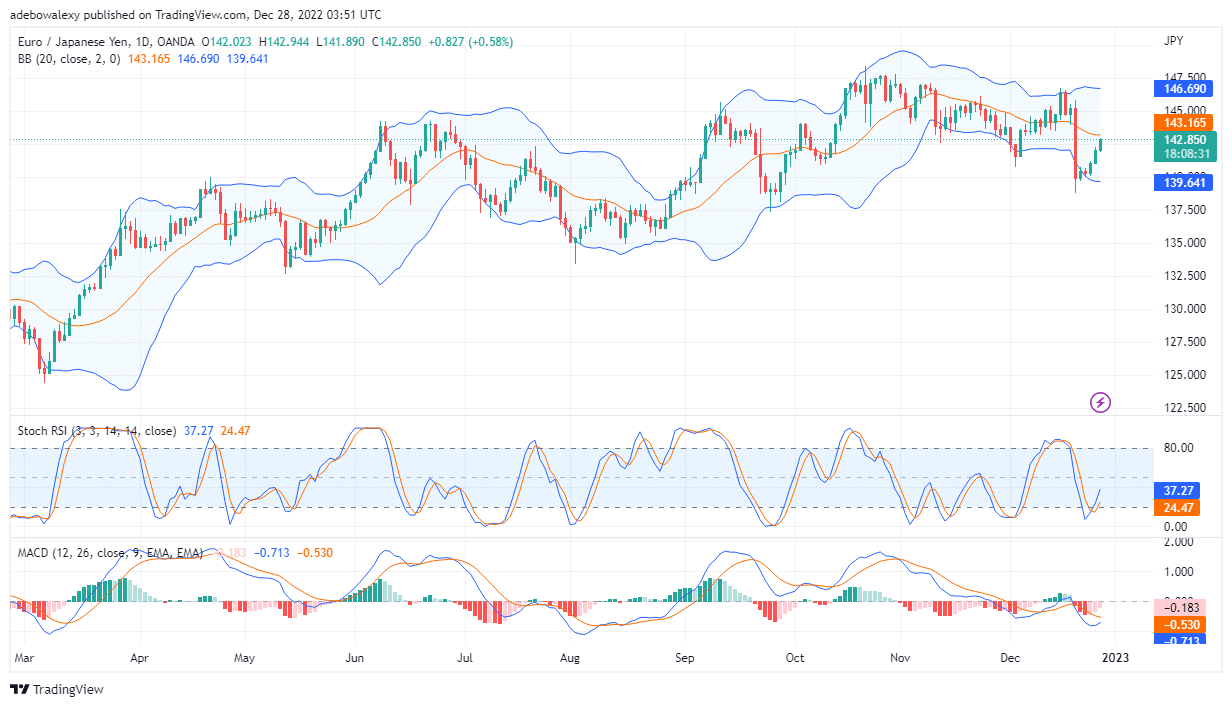
On the Daily EUR/JPY market price action took a strong upside bounce off the lower limit of the Bollinger Band. This could be observed as three moderate-size bullish price candles have formed over the past two trading sessions, till now. Furthermore, lines of the Stochastic RSI are now moving steeply upwards towards the 40 levels. Meanwhile, the MACD indicator lines as well are now moving more sharply towards a bullish crossover below the equilibrium point. Also, the recent histogram bars on the MACD Indicator are revealing that upside momentum is getting stronger, subsequently reducing downward momentum. Consequently, this may give traders more buying confidence, which will subsequently result in more price increases in this market.

EUR/JPY Keeps Gaining Upside Traction
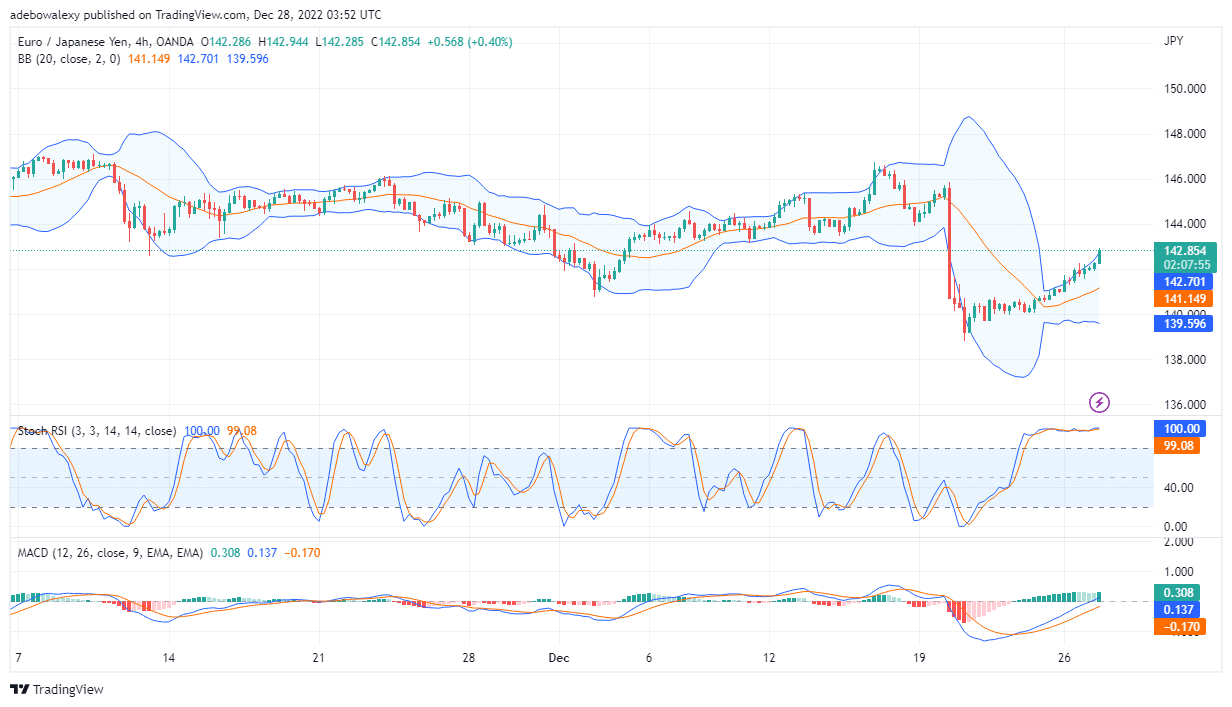
Price activity on the 4-hour EUR/JPY market portrays that the pair is gaining more upside traction. Since the past eleven trading sessions ago, price candles can be seen forming at the upper limit of the Bollinger Band. This has stretched the upper limit of the Bollinger Band and has pushed the price significantly upwards. Also, the lines of the RSI remain mangled in the overbought region. Consequently, this shows that tailwind in this market is relentless for now. The MACD lines as well keep moving smoothly upwards, and towards the equilibrium level. Additionally, the latest histogram on this indicator indicates that the current market move is strong, and may continue. Therefore, traders can anticipate that price action in this market may reach the 144.00 price mark.
Do you want to take your trading to the next level? Join the best platform for that here.


Leave a Reply