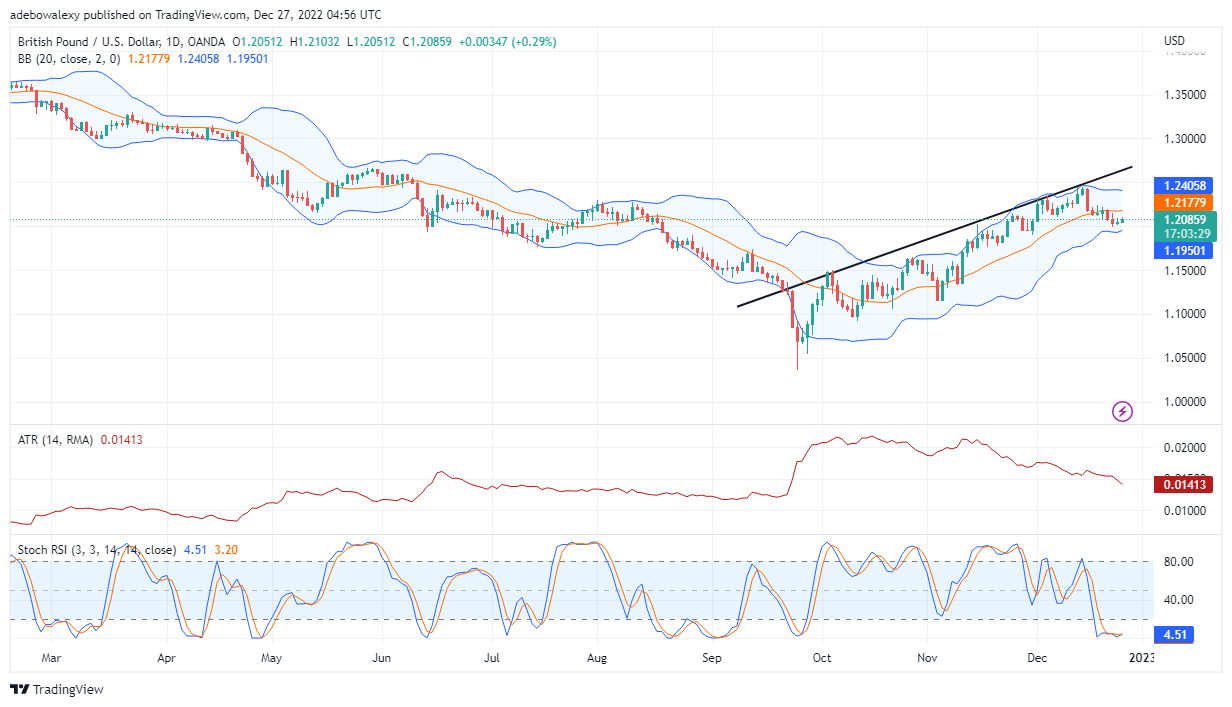
The GBP/USD price movement has retraced to lower levels and has stayed down in recent times. This happened after the pair reached nearly 1.2406. Also, technical indicators too aren’t showing enough upside prospects in this market.
Major Price Levels:
Top Levels: 1.2086, 1.2120, 1.2170
Floor Levels: 1.2036, 1.2000, 1.1960

GBP/USD Records Only Minimal Gains
From the previous trading session, price action on the GBP/USD daily market seems to have witnessed only little buying. However, trading activities keep happening under the middle limit of the Bollinger Band (MA line). Meanwhile, the ATR indicator, largely reveals that the current market trend is more bearish. Additionally, the Stochastic RSI lines stay mangled in the oversold region. However, with careful observation of the terminal parts of the RSI lines, one will see that a bullish crossover has been given. Consequently, this portrays the minimal gains recorded recently in the market. For the most part, the GBP/USD may not experience a significant upside move in the meantime.

GBP/USD Price Action Continues to Show Lack of Significant Momentum
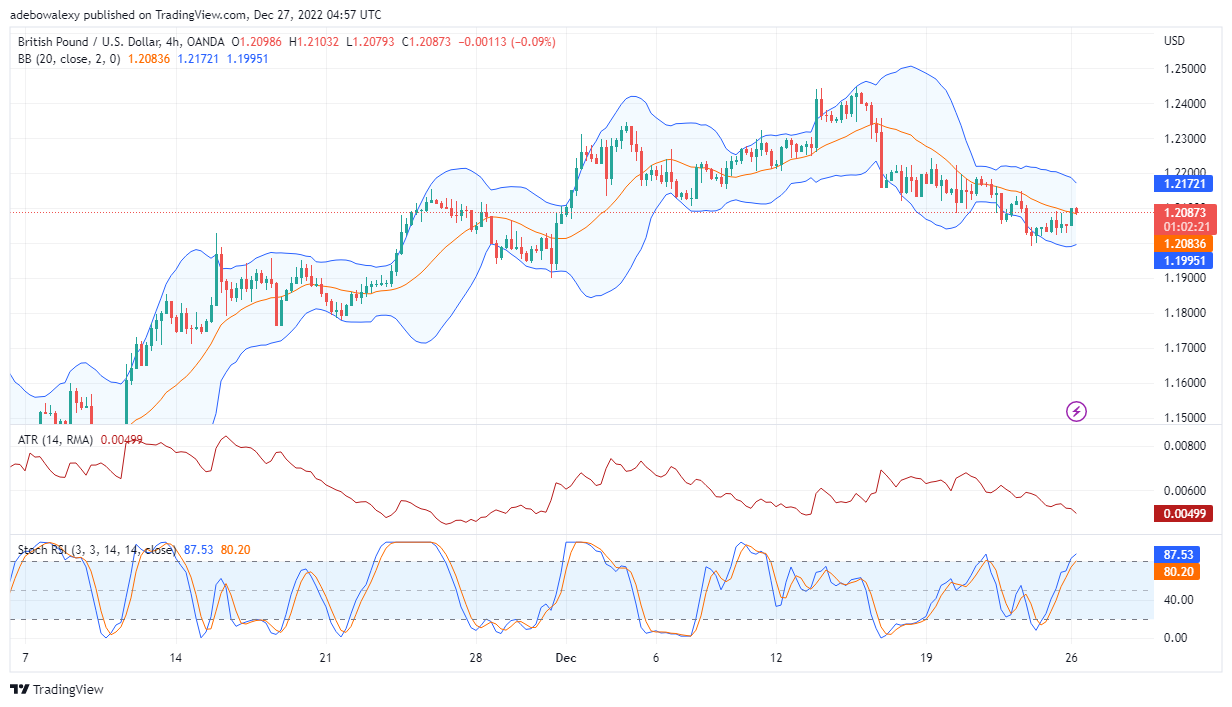
Coming to the GBP/USD 4-hour market, we can see that signs of weakness are persisting in this market. Here, the RSI lines have quickly risen into the overbought region while the price has only managed to reach the MA line of the Bollinger Band. Also, the ATR indicator continues to point downward and is at a level of 0.00499, indicating a bearish market. Furthermore, the last price candle on this chart has plunged the price downwards to the level of the MA line. In the meantime, price activity may only move around the 1.2087 level, as it seems like a strong resistance level.
Do you want to take your trading to the next level? Join the best platform for that here.


Leave a Reply