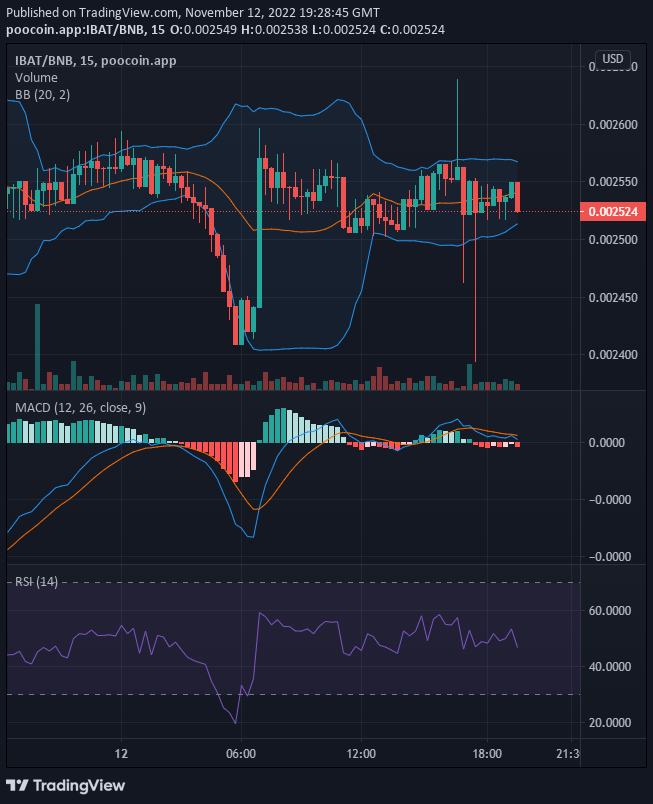
As the bear market hits the $0.0024, they were faced with strong support at that price level. The Battle Infinity sellers made an unrealistic attempt testing $0.002 level. Buyers also made the same unrealistic attempt, testing $0.0036. All these happened within the one-hour trading period. Usually, such overly strong bearish moves within a short period will always trigger a bearish move. However, the bulls were able to retain some bullish price with the support level still at $0.0024.
Key Levels
- Resistance: $0.0026, $0.0027, $0.0028
- Support: $0.0024, $0.0023, $0.0022
IBAT/USD: The Indicators’ Outlook
Although the buyers were still able to retain some bullish price, they also secure a higher support near the resistance where the undecisive market ranges sideways. The new support is at $0.0025 and the resistance at $0.00256. There is going to bullish price breakout because the support has shifted up closer with the resistance. The price channel formed by the Bollinger indicator is moving on a horizontal level.

Battle Infinity Short-Term Outlook: Bullish Recovery (15-minute chart)
The price oscillates between the buy zone and the sell zone. The MACD portrays the market almost exactly as the price action behaves on the chart. On the chart, the price of IBAT swings across the moving average as it moves on a horizontal level. With the support now nearer to the resistance, we can expect the price moving upward soon.
Want a coin that has a huge potential for massive returns? That coin is Battle Infinity.
Buy IBAT now.


Leave a Reply