AUD/USD Price Prediction – November 13
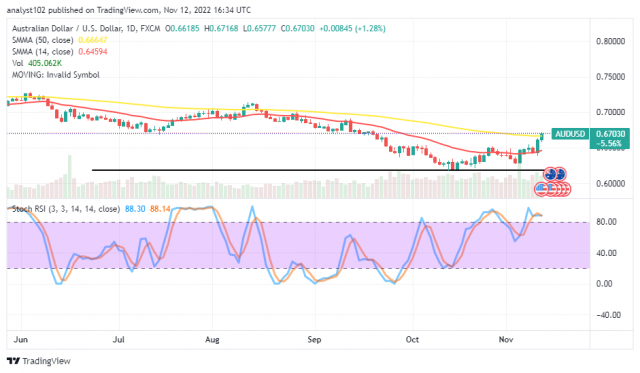
As a result of the bullish momentum remaining firm in the AUD/USD trade activities, the currency pair market lines have increased to the 0.6700 level. Price is trading at an average positive percentage rate of 1.28, keeping the bargaining point around 0.67030.
AUD/USD Market
Key Levels:
Resistance levels: 0.6800, 0.6900, 0.7000
Support levels: 0.6350, 0.6250, 0.6150
AUD/USD – Daily Chart
The daily chart reveals that the currency pair market line increases to 0.6700, making efforts to surge past the SMA trend lines. The 50-day SMA indicator is at 0.66647 points above the 0.64594 value line of the 14-day SMA indicator. The horizontal line drew around 0.6200 lower spots to ascertain where the present buying spree sprung. The Stochastic Oscillators are in the overbought region, trying to consolidate at the 88.14 and 88.30 levels to indicate that bullish momentum is relatively uprising.
Will the AUD/USD market continue to strive for long-term gains above the SMAs?
The AUD/USD trade may continue to struggle for long-term gains over the trend lines of the SMAs as the currency pair line increases to 0.6700. If the market experiences a reversal that results in a bearish engulfing pattern at a high-trading zone, bulls will have to place their new entry position order on a checkmate note.
On the technical downside, sellers would have to be alert of less-active motion to the upside coupling active downward moves that can emanate around or between the above resistance value lines stated before executing a sell order.
A short glance at the technical analysis has it on the suggestion note that the AUD/USD market sellers would have to be vigilant to know when there’ll be a correction against the 50-day SMA trend line to observe a shorting order position.
AUD/USD 4-hour Chart
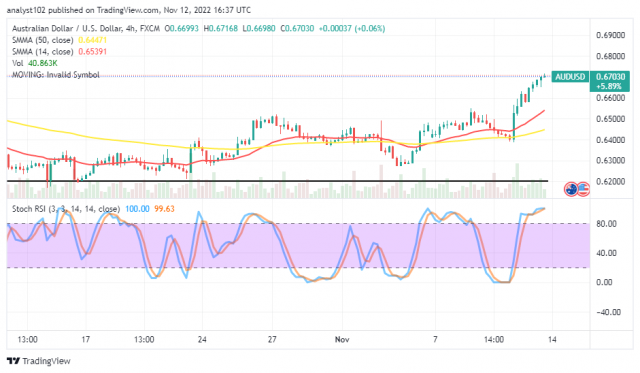
The AUD/USD medium-term chart showcases the currency pair line increase to the 0.6700 high-trading zone. The 14-day SMA indicator is at 0.65391 points over the 0.64471 value line of the 50-day SMA indicator. The Stochastic Oscillators are in the overbought region. And they are at 99.63 and 100 levels. That shows upward pressures are at maximum trading points, suggesting a dicey outcome against seeing more sustainable ups in the following operations.
Note: Forexschoolonline.com is not a financial advisor. Do your research before investing your funds in any financial asset or presented product or event. We are not responsible for your investing results.
Learn to Trade Forex Online
AUD/USD Market Line Increases to 0.6700
Footer

ForexSchoolOnline.com helps individual traders learn how to trade the Forex market
WARNING: The content on this site should not be considered investment advice and we are not authorised to provide investment advice. Nothing on this website is an endorsement or recommendation of a particular trading strategy or investment decision. The information on this website is general in nature so you must consider the information in light of your objectives, financial situation and needs.
Investing is speculative. When investing your capital is at risk. This site is not intended for use in jurisdictions in which the trading or investments described are prohibited and should only be used by such persons and in such ways as are legally permitted. Your investment may not qualify for investor protection in your country or state of residence, so please conduct your own due diligence or obtain advice where necessary. This website is free for you to use but we may receive a commission from the companies we feature on this site.
We Introduce people to the world of currency trading. and provide educational content to help them learn how to become profitable traders. we're also a community of traders that support each other on our daily trading journey
Forexschoolonline.com is not a financial advisor. Do your research before investing your funds in any financial asset or presented product or event. We are not responsible for your investing results.

Leave a Reply