AUD/USD Price Prediction – October 31
It has occurred that the AUD/USD market rate revisits the 0.6400 resistance as there have also been attempts to surge high above it. As of the time of writing, the currency pair price trades around 0.6419 at an average percent of 0.12 minutely positive.
AUD/USD Market
Key Levels:
Resistance levels: 0.6450, 0.6550, 0.6650
Support levels: 0.6300, 0.6200, 0.6100
AUD/USD – Daily Chart
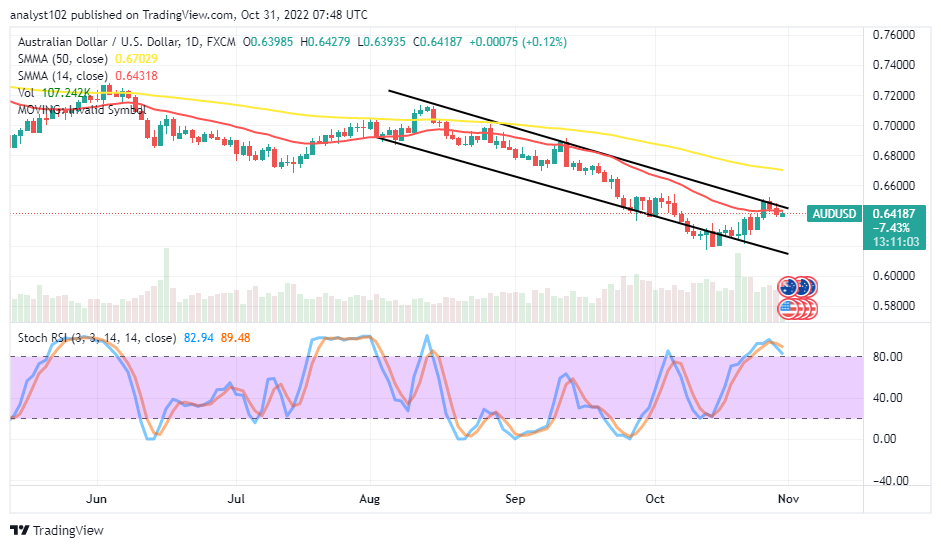
The AUD/USD daily chart reveals that the currency pair market rate revisits the 0.6400 resistance around the positioning stature of the smaller SMA trend line. The 50-day SMA indicator is at the 0.67029 value line, above the 0.64318 value of the 14-day SMA trading indicator. The Stochastic Oscillators are at 89.48 and 82.94 range points in the overbought region, keeping a southbound-crossing outlook close to a lower range value near 80.  Will the AUD/USD market extend its moves sustainably over 0.6400?
The gravitational force, as signaled by the reading of the Stochastic Oscillators, is lowlily composed in terms of sustainable upholding over the 0.6400 as the currency pair market rate revisits the value line currently. For long-position placers to maintain a stance around the trading zone, a pit stop will have to play out for some time before such a scenario can be afterward.
On the technical downside, it has been that the price had initially pushed for a touch of resistance higher than 0.6400 of around 0.6500 during the last Week’s Wednesday session. And that may be giving the AUD?USD market sellers have the insight to execute a sell order, settling a stop loss around the higher point or not too far above the value line.
A quick peek at the technical analysis indicates a likelihood of the AUD/USD market bears regaining the upper hand against the majority of buying forces that mostly came from behind the resistance of 0.6600 for some days. AUD/USD 4-hour Chart
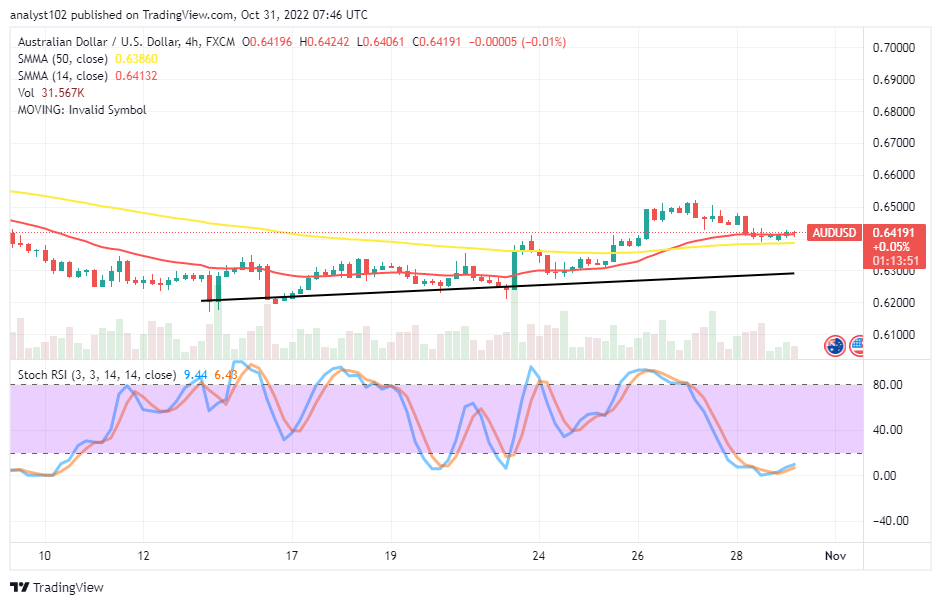
The medium-term AUD/USD chart depicts the pairing fiat coin pushed to touch a resistance point around the 0.6500 level. The trading situation, as of writing, shows the market trading around the trend line of the smaller SMA. The 50-day SMA trend line is at 0.63860 value line, underneath the 0.64132 points of the 50-day SMA trend line. The bullish trend line is drawn below them to signify that the trending outlook is relatively bullish. The Stochastic Oscillators have dipped into the oversold region to maintain 6.43 and 9.44 range values at a northbound-crossing mode.
Note: Forexschoolonline.com is not a financial advisor. Do your research before investing your funds in any financial asset or presented product or event. We are not responsible for your investing results.


Leave a Reply