AUD/USD Price Prediction – October 2
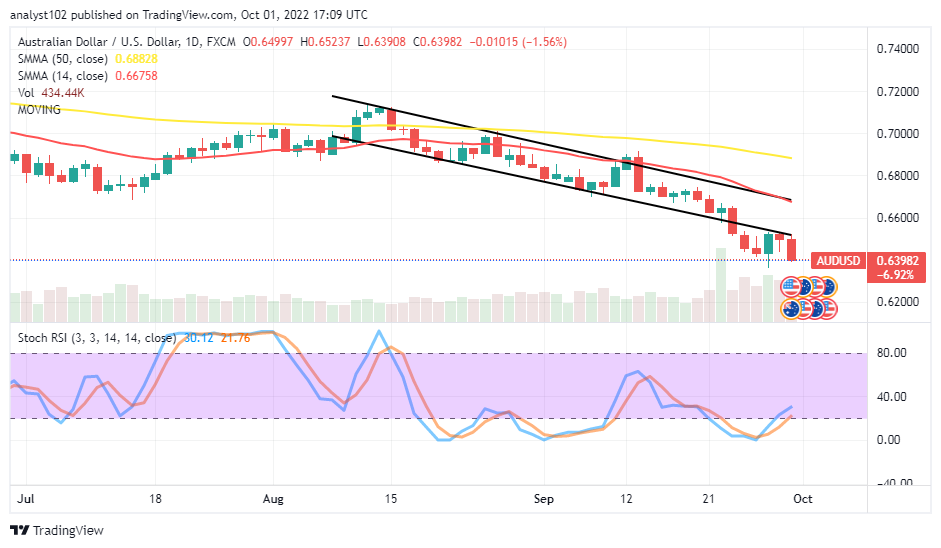
There has been a significant decline in the valuations of the AUD/USD pairing coin as the price trades lower pips below the 0.6500 resistance line. The currency pair market is at an average of about 133 pips difference between the high and low-value lines of 0.65237 and 0.63908, keeping a 1.56% negative.
AUD/USD Market
Key Levels:
Resistance levels: 0.6500, 0.6600, 0.6700
Support levels: 0.6300, 0.6200, 0.6100
AUD/USD – Daily Chart
The AUD/USD daily chart reveals the currency pair price trades lower pips below the 0.6500 resistance level that was serving as the previous support some days ago. All the indicators are above the current trading zone, depicting the market is in an intensely declining mode. The 14-day SMA indicator is at the 0.66758 value line, beneath the 0.68828 points of the 50-day SMA indicator. The bearish trend lines drew southward as even the lower trend line has breached by a bearish trading candlestick. The Stochastic Oscillators have swerved northbound from the oversold region to reach 30.12 and 21.76 range points. Will the AUD/USD market show more offs to the downside?
The trading outlook in the AUD/USD market yet portends no sign of changing abruptly from declining as the pairing coin’s price trades lower pips below the 0.65000 resistance. Re-buying orders may surface after the completion of the current falling move at a lower-trading zone.
On the downside of the technical, the AUD/USD market bears may still be firm in their stances to push downward further, making the 0.6500 resistance level the retarding point that may stay over some subsequent sell-offs. Traders may resort to using smaller time frames to detect the early resumption of a downward-trending motion.
The analytics, at a glance, bears still appear to have a stance firmer against the trending ability of bulls, especially if the 0.6500 resistance level remains un-breached. AUD/USD 4-hour Chart
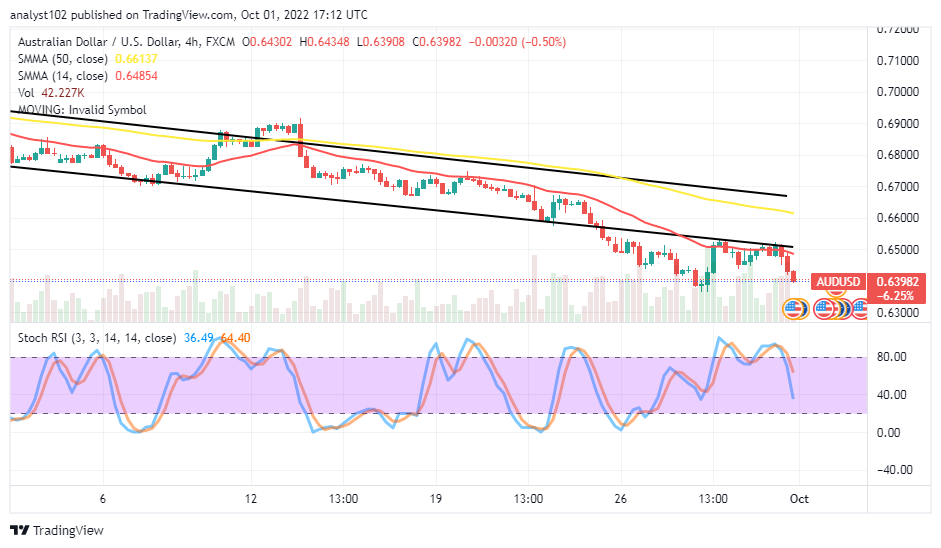
The AUD/USD medium-term chart showcases the currency pair price trades lower pips below 0.6500 after hitting resistance around it. The 14-day SMA indicator is at 0.64854, underneath the 0.66137 value line of the 50-day SMA indicator. The Stochastic Oscillators have crossed southbound from the overbought region to the range values of 64.40 and 36.49., denoting the market may still go down for a while until a rebound occurs.
Note: Forexschoolonline.com is not a financial advisor. Do your research before investing your funds in any financial asset or presented product or event. We are not responsible for your investing results.
Learn to Trade Forex Online
AUD/USD Price Trades Lower Pips Below 0.6500
Footer

ForexSchoolOnline.com helps individual traders learn how to trade the Forex market
WARNING: The content on this site should not be considered investment advice and we are not authorised to provide investment advice. Nothing on this website is an endorsement or recommendation of a particular trading strategy or investment decision. The information on this website is general in nature so you must consider the information in light of your objectives, financial situation and needs.
Investing is speculative. When investing your capital is at risk. This site is not intended for use in jurisdictions in which the trading or investments described are prohibited and should only be used by such persons and in such ways as are legally permitted. Your investment may not qualify for investor protection in your country or state of residence, so please conduct your own due diligence or obtain advice where necessary. This website is free for you to use but we may receive a commission from the companies we feature on this site.
We Introduce people to the world of currency trading. and provide educational content to help them learn how to become profitable traders. we're also a community of traders that support each other on our daily trading journey
Forexschoolonline.com is not a financial advisor. Do your research before investing your funds in any financial asset or presented product or event. We are not responsible for your investing results.

Leave a Reply