GBP/USD Price Prediction – September 27
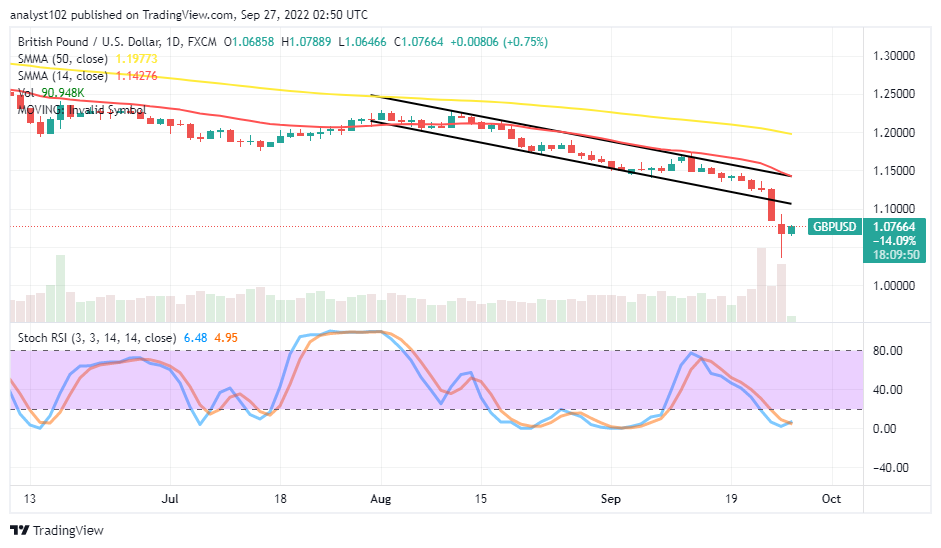
There has been an enormous and unimaginable loss of momentum by the GBP/USD market bulls as the currency pair price drops so aggressively from around the point of 1.1700 to the lower tune of 1.0400. That is not less than 1,300 losses of pips. As of the time of writing, price has rallied to 1.0766 at a minute positive percentage rate of 0.75.
GBP/USD Market
Key Levels:
Resistance levels: 1.1000, 1.1200, 1.1400
Support levels: 1.0400, 1.0300, 1.0200
GBP/USD – Daily Chart
The GBP/USD daily chart showcases the currency pair market drops aggressively to the 1.0400 support level. A slight rebounding motion occurred yesterday while the price breached feebly past the value line to the downside, leading to the birth of the current smaller bullish candlestick far below the trading tools. The 14-day SMA indicator is at the 1.14276 line, underneath the 1.19773 value line of the 50-day SMA indicator. The Stochastic Oscillators are around 4.95 and 6.48 range points to denote the capacity pace at which the market has pushed upward from its current slippages. Where is the logical resistance point to getting a sell entry in the GBP/USD market operations?
The logical resistance trading zone to get a sell entry in the GBP/USD market has proved to be around the trend line of the 14-day SMA’s value point. Buyers should have joined the rallying motion from around 1.0500 by applying for a trailing stop approach order.
On the downside of the technical analytics, the bearish trading cycle is still in focus as the market seamlessly rallied from a lower-trading spot around the 1.0400 support to a higher line below the sell signal side of the SMA trend lines. It would be ideal to allow other rounds of pull-ups to get resistance at a high-trading zone before considering launching a shorting order.
Summarily, traders needed to wait for a trading pattern that supports the execution of a selling order at a high-resistance trading spot around the indicators after a while, as believed that the GBP/USD market is still in the depth of the bearish cycle. GBP/USD 4-hour Chart
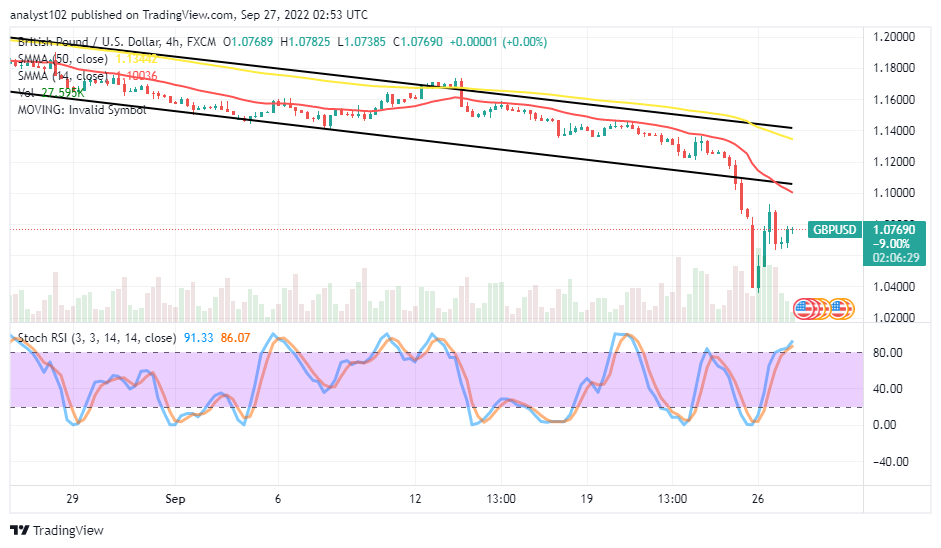
The GBP/USD medium-term chart reveals the pairing currency price drops aggressively to the 1.0400 support level. There have been convergences of candlesticks around the lower-trading zone, causing a rallying mouton to a reasonable extent below the SMAs. The 14-day SMA indicator is at 1.10036, underneath the 1.13442 value point of the 50-day SMA indicator. The Stochastic Oscillators are in the overbought region, maintaining 86.07 and 91.33 range points. Price may push for a touch of resistance around the 1.10000 level before reverting to a declining move afterward.
Note: Forexschoolonline.com is not a financial advisor. Do your research before investing your funds in any financial asset or presented product or event. We are not responsible for your investing results.
Learn to Trade Forex Online
GBP/USD Market Drops Aggressively to 1.0400 Support
Footer

ForexSchoolOnline.com helps individual traders learn how to trade the Forex market
WARNING: The content on this site should not be considered investment advice and we are not authorised to provide investment advice. Nothing on this website is an endorsement or recommendation of a particular trading strategy or investment decision. The information on this website is general in nature so you must consider the information in light of your objectives, financial situation and needs.
Investing is speculative. When investing your capital is at risk. This site is not intended for use in jurisdictions in which the trading or investments described are prohibited and should only be used by such persons and in such ways as are legally permitted. Your investment may not qualify for investor protection in your country or state of residence, so please conduct your own due diligence or obtain advice where necessary. This website is free for you to use but we may receive a commission from the companies we feature on this site.
We Introduce people to the world of currency trading. and provide educational content to help them learn how to become profitable traders. we're also a community of traders that support each other on our daily trading journey
Forexschoolonline.com is not a financial advisor. Do your research before investing your funds in any financial asset or presented product or event. We are not responsible for your investing results.

Leave a Reply