AUD/USD Price Prediction – September 19
Selling pressures are intensely coming at a lower-trading spot as the AUD/USD market bears consolidate stances at the 0.6700 line. The currency pair market is at a minute negative percentage rate of 0.44, trading at 0.66891.
AUD/USD Market
Key Levels:
Resistance levels: 0.6800, 0.6900, 0.7000
Support levels: 0.6600, 0.6500, 0.6400
AUD/USD – Daily Chart
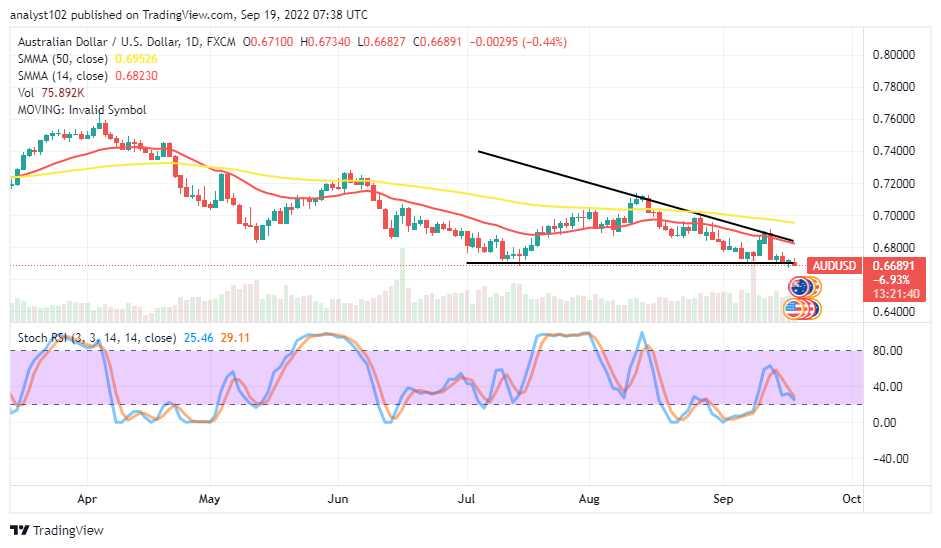
The daily chart portrays the AUD/USD market bears consolidate stances at the 0.6700 level. The 50-day SMA indicator is at 0.69526 above the 0.68230 value point of the 14-day SMA indicator. The horizontal line drew at the consolidation trading value line to ascertain the operations presently. The Stochastic Oscillators have crossed southbound from around the range of 60 toward the 29.11 and 25.46 range value lines. That situation portends that a declining motion is in progress. Will the current falling force get tougher to breach past the AUD/USD market at the 0.6700 level?
Going by the pace of pushing off the falling force in the AUD/USD market operations, the price tends to succumb to some lows after breaking past the 0.6700 level in the subsequent sessions, as acknowledged that bears consolidate stances around the value line presently. Buyers are to be alert if a rebound will surface along the declining process before considering launching a buying order.
On the downside of the technical, as of the writing, the AUD/USD market sellers would have to follow an active staging against the 0.6700 trading level on a timely basis to avoid the possibility of being whipsawed while exerting a selling order lately.
The analytics, at a glance, the AUD/USD market bears are exerting a force against the inactiveness of bulls around the 0.6700 level that can lead to some lows in the following days’ activities. AUD/USD 4-hour Chart
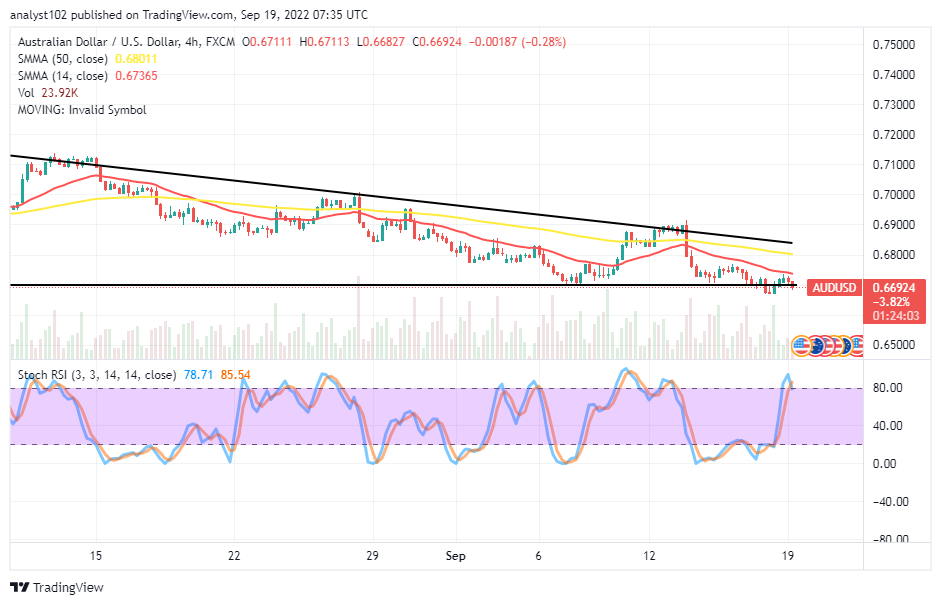
The AUD/USD medium-term chart showcases the currency pair market bears consolidating stances at the 0.6700 level below the smaller SMA trend line. The 14-day SMA indicator is at 0.67365, underneath the 0.68011 value point of the 50-day SMA indicator. The Stochastic Oscillators are in the overbought region, trying to cross southbound. And they are at 85.54 and 78.71 range values. That signifies the pairing coin trade stands the risk of basing in the near time.
Note:Forexschoolonline.com is not a financial advisor. Do your research before investing your funds in any financial asset or presented product or event. We are not responsible for your investing results.
Learn to Trade Forex Online
AUD/USD Market Bears Consolidate Stances at 0.6700
Footer

ForexSchoolOnline.com helps individual traders learn how to trade the Forex market
WARNING: The content on this site should not be considered investment advice and we are not authorised to provide investment advice. Nothing on this website is an endorsement or recommendation of a particular trading strategy or investment decision. The information on this website is general in nature so you must consider the information in light of your objectives, financial situation and needs.
Investing is speculative. When investing your capital is at risk. This site is not intended for use in jurisdictions in which the trading or investments described are prohibited and should only be used by such persons and in such ways as are legally permitted. Your investment may not qualify for investor protection in your country or state of residence, so please conduct your own due diligence or obtain advice where necessary. This website is free for you to use but we may receive a commission from the companies we feature on this site.
We Introduce people to the world of currency trading. and provide educational content to help them learn how to become profitable traders. we're also a community of traders that support each other on our daily trading journey
Forexschoolonline.com is not a financial advisor. Do your research before investing your funds in any financial asset or presented product or event. We are not responsible for your investing results.

Leave a Reply